Hello, everyone!
Today I noticed the insane chart pattern on the
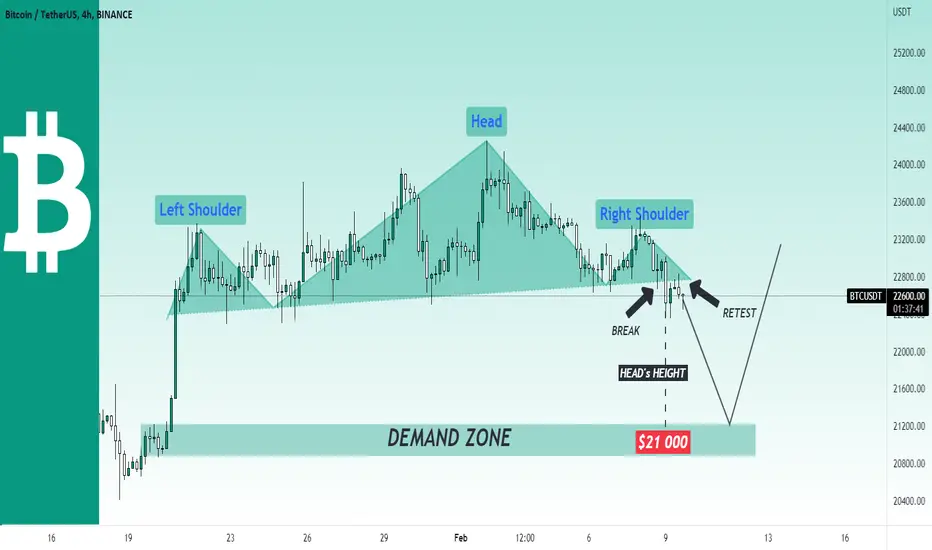
 BTCUSDT price chart. Bitcoin is showing the weakness last week and now it completed the head & shoulders chart pattern. Notice that it's neckline has been already broken and BTC has successfully retested it.
We saw the reaction on this neckline, therefore I expect the dump to the nearest demand zone at $21k. There I am going to buy Bitcoin with the further potential increase to $28k.
Best regards, Ivan
Today I noticed the insane chart pattern on the
We saw the reaction on this neckline, therefore I expect the dump to the nearest demand zone at $21k. There I am going to buy Bitcoin with the further potential increase to $28k.
Best regards, Ivan
Claim up to 600 USDT in welcome rewards & compete for a share of 5,000 USDT in BitMart Futures Contest!
➡ Register & Claim Bonus: bitmart.com/invite/VShg8M
➡ Join Contest: bitmart.com/futures-competition/Skyrexio/en-US
➡ Register & Claim Bonus: bitmart.com/invite/VShg8M
➡ Join Contest: bitmart.com/futures-competition/Skyrexio/en-US
Related publications
Disclaimer
The information and publications are not meant to be, and do not constitute, financial, investment, trading, or other types of advice or recommendations supplied or endorsed by TradingView. Read more in the Terms of Use.