Hello, traders.
If you "follow", you can always get the latest information quickly.
Have a nice day today.
-------------------------------------
(BTCUSDT 1M chart)
A new month begins in one day.
The key is whether it can hold the price by rising above 109588.0.
If not, there is a possibility that it will fall below the 94172.00 StochRSI 50 indicator point that the arrow is pointing to.
We need to see if it can rise with support near the Fibonacci ratio of 1.618 (89050.0).
Since the current low-point trend line is not complete, it is not surprising that it can show a downward trend at any time.
However, if it rises above 109588.0 and maintains the price, it is expected that there will be an attempt to rise near the Fibonacci ratio of 2.618 (133889.92).
I think it is likely to be the last target of the target bull market in 2025.
-
(1W chart)
It is a period of volatility around the week including June 23.
That is, from June 16 to July 6 is the volatility period.
The key is whether it can rise to the right Fibonacci ratio 2.24 (116940.43) during this volatility period.
Even if it fails to rise, if the price maintains above 104463.99, it is expected to show an upward trend around the next volatility period.
The next volatility period on the 1W chart is expected to be around the week of August 18.
-
When it falls below 104463.99, we need to check whether the HA-High indicator is newly generated.
If not, it is important to check whether there is support around the current HA-High indicator point of 99705.62.
Since the M-Signal indicator on the 1W chart is passing around 99705.62, its importance can be said to be high.
If it falls below the M-Signal indicator of the 1W chart, it is expected to determine the trend again when it meets the M-Signal indicator of the 1M chart.
-
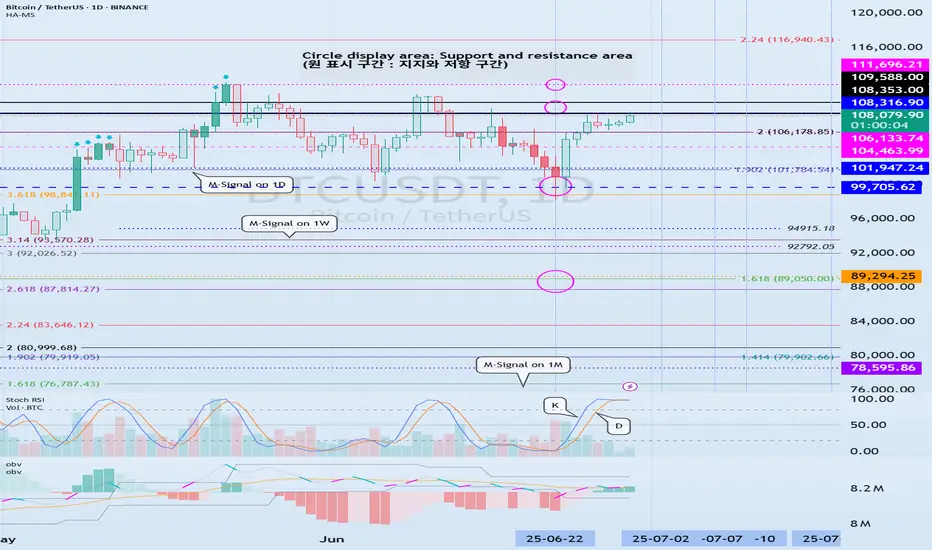
(1D chart)
The key is whether it can maintain the price by rising above the HA-High indicator point of 108316.90 on the 1D chart.
If it fails to rise,
1st: 104463.99
2nd: 99705.62
You should check for support near the 1st and 2nd above.
If it falls below the M-Signal indicator of the 1W chart,
1st: 89294.25
2nd: M-Signal of the 1M chart
There is a possibility that it will fall near the 1st and 2nd above.
-----------------------------------------
(1W chart)
The chart above is a trend line chart drawn on the 1W chart.
It looks complicated, but what's important to look at is the correlation between the high-point trend line and the low-point trend line.
That is, even if the price rises above 109.588.0, if it doesn't rise above the high-point trend line, it is likely to fall near the low-point trend line.
Fortunately, since it is forming an upward channel, it is expected that the price will eventually rise even if it falls.
-
(1D chart)
Unlike the trend line on the 1W chart, the high-point trend line on the 1D chart forms a downward trend line.
Accordingly, the period around July 7, when the low-point trend line and the high-point trend line intersect, can be considered an important period of volatility.
However, the volatility period starts around July 2nd and is expected to end around July 10th.
----------------------------------------------
As shown above, many lines were drawn to analyze the chart.
I have roughly explained which of the lines drawn in this way should be prioritized.
Since chart analysis is for creating a trading strategy, the support and resistance points drawn on the 1M, 1W, and 1D charts are ultimately the most important.
Therefore, it is most important to check how the support and resistance points were created and find the reason for them.
Other analyses are only additional elements.
As I always say, chart analysis that does not show support and resistance points is only an analysis chart that can be used for trading.
You cannot trade with such analysis charts.
Also, if support and resistance points are shown, you should check the basis for setting the support and resistance points.
In order to serve as a support and resistance point, there must be a basis.
When you cannot confirm the basis for the support and resistance point, it is important to ask questions and find out the basis.
Fibonacci ratios are not suitable for actual trading.
However, when the ATH or ATL is updated, it is valuable enough for analysis.
Other than that, there must be support and resistance points drawn on the 1M, 1W, and 1D charts.
-
Thank you for reading to the end.
I hope you have a successful trade.
--------------------------------------------------
- This is an explanation of the big picture.
(3-year bull market, 1-year bear market pattern)

I will explain more details when the bear market starts.
------------------------------------------------------
※ Follow X to check out the posts.
※ X를 팔로우하고 게시물을 확인하세요.
◆ t.me/readCryptoChannel
[HA-MS Indicator]
bit.ly/3YxHgvN
[OBV Indicator]
bit.ly/4dcyny3
※ X를 팔로우하고 게시물을 확인하세요.
◆ t.me/readCryptoChannel
[HA-MS Indicator]
bit.ly/3YxHgvN
[OBV Indicator]
bit.ly/4dcyny3
Related publications
Disclaimer
The information and publications are not meant to be, and do not constitute, financial, investment, trading, or other types of advice or recommendations supplied or endorsed by TradingView. Read more in the Terms of Use.