Hi All,
Its my opinion based on recent price action that we will be here a lot longer and will do something of the nature like we did under the 20K resistance, a similar fractal.
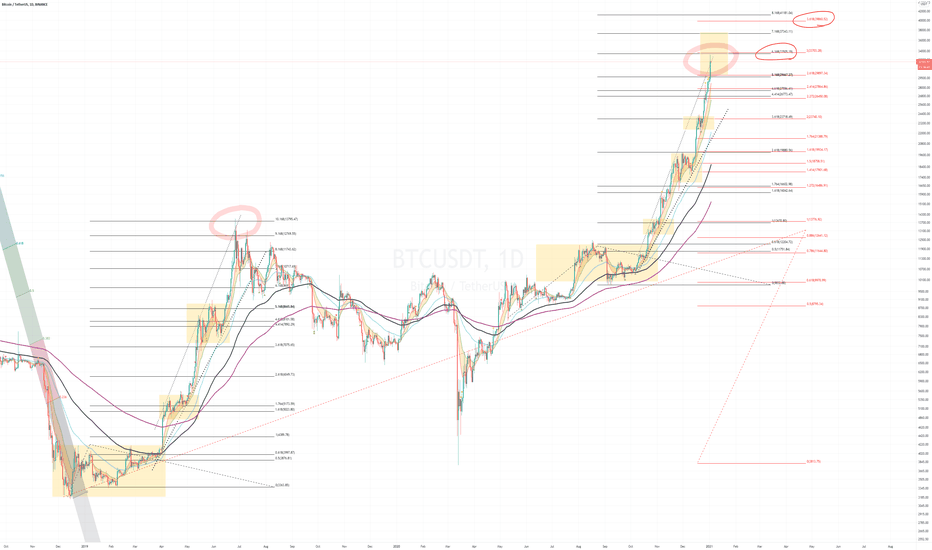
It makes sense as we have hit a key level of a goldern ratio extension and or doubled basically the previous all time high.
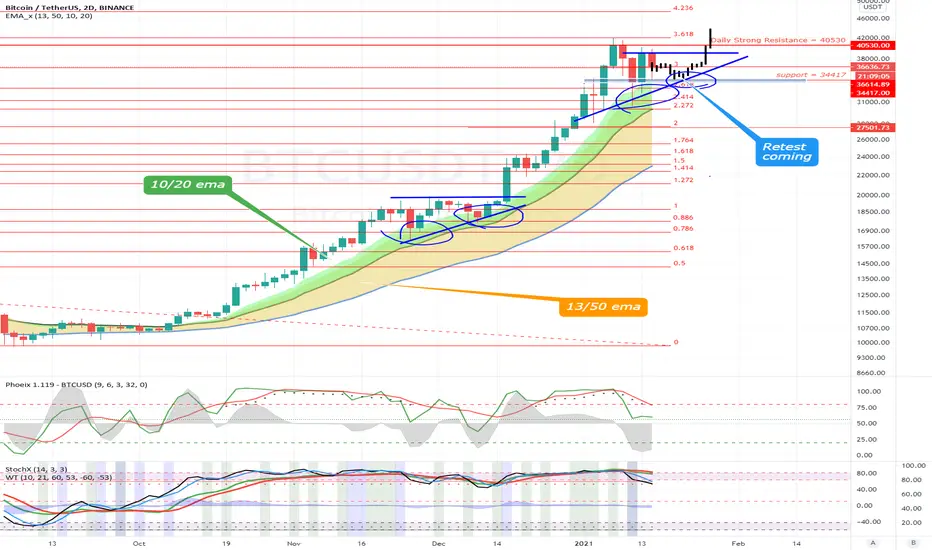
Looking at the 2 Day and 1 Day chart, we can see previously how the 10/20 ema was support and was tested x2 as it moved sideways, as per chart below.
Hence 34400 is a strong support level and it equates to both the 10/20 ema ribbon on the 2 Day chart as well as the 2 day candle support level;
The indicators , phoeix also shows us that there is downward pressure along with the daily.
Just keeping it short.
Cheers,
S.SAri
Daily chart TA: Observer how the Red and Green RSI is heading for below 50% while the grey energy is, indicating downward pressure on the daily.
=====================================

2 DAY chart
=====================================

==========================================================================
current macro resistance

For the x.618 goldern ratio extensions, look at my previous post.
Its my opinion based on recent price action that we will be here a lot longer and will do something of the nature like we did under the 20K resistance, a similar fractal.
It makes sense as we have hit a key level of a goldern ratio extension and or doubled basically the previous all time high.
Looking at the 2 Day and 1 Day chart, we can see previously how the 10/20 ema was support and was tested x2 as it moved sideways, as per chart below.
Hence 34400 is a strong support level and it equates to both the 10/20 ema ribbon on the 2 Day chart as well as the 2 day candle support level;
The indicators , phoeix also shows us that there is downward pressure along with the daily.
Just keeping it short.
Cheers,
S.SAri
Daily chart TA: Observer how the Red and Green RSI is heading for below 50% while the grey energy is, indicating downward pressure on the daily.
=====================================
2 DAY chart
=====================================
==========================================================================
current macro resistance
For the x.618 goldern ratio extensions, look at my previous post.
Note
1 hrly, short termNote
1 hrly chart update. It looks like this channel is valid as we get a response mid section of it. My guess would be that it pulls back a bit and tries for another attempt to pass it. If the 13/50 ema cross over (1 hrly), its a bullish sign to enter.Note
Note
Note how the 13/50 ema did not cross overNote
Note
As to the target of the drop, we cannot now this, until we see it in action. It could be a dramatic drop or slow... just have to wait and see. I have downward pressure all the way to the daily chart.
Note
This could go anywhere...I'm wondering if we have an AB=CD target. Has confluence with the support level\channel as per my original post, daily 20 ema.Note
Note
looking at the bottom 4 hrly candle, it looks bullish. Its getting late so the next candle will tell the story. Trade closed: target reached
I'm closing this post as it reached my target perfectly. It also shows that lines or support level \ resistance on this chart are correct. How it plays out here is another matter. I believe its creating a big structure for a big breakout, until this impulse is completed, we will then have another clue.Note
just looking at the dimensions in this macro structure and if this plays out, it will be ideal as it points to a macro bullish structure.Note
Discord: discord.com/invite/vb4hbP88vb (TradeToProspa)
Telegram: t.me/TprospaTradersbot
This community has signals now but with no risk management comms.
Telegram: t.me/TprospaTradersbot
This community has signals now but with no risk management comms.
Related publications
Disclaimer
The information and publications are not meant to be, and do not constitute, financial, investment, trading, or other types of advice or recommendations supplied or endorsed by TradingView. Read more in the Terms of Use.