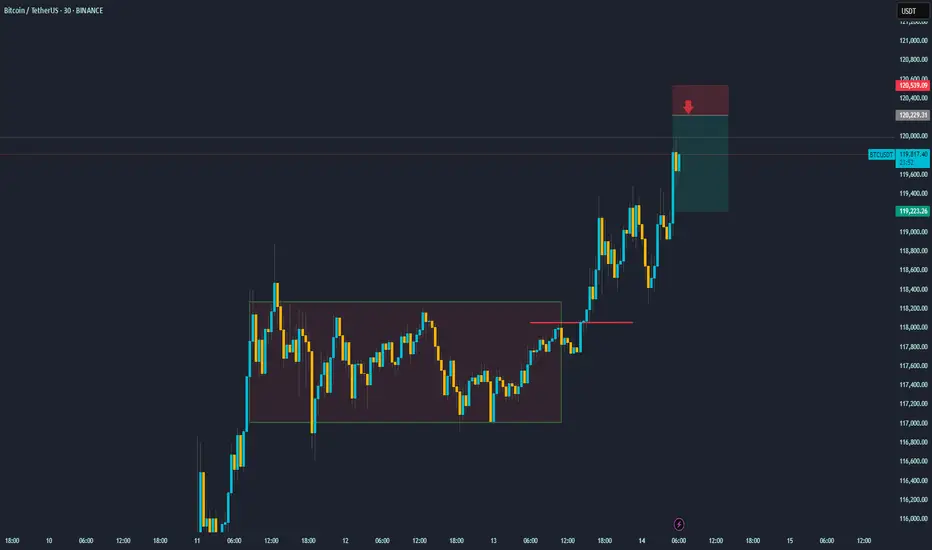
This 30-minute BTC/USDT chart provides an excellent case study. After successfully identifying and trading the breakout from the consolidation range (highlighted in the brown box), the focus now shifts to a new, potential trade setup.
Asset: Bitcoin / TetherUS (BTC/USDT)
Timeframe: 30-Minute
Recap: The price has powerfully broken out of its previous range, a move that was anticipated and resulted in a successful long trade.
Current Situation: Following the strong, nearly vertical rally, the price is approaching the psychological $120,000 level. Runs like this are often followed by a period of profit-taking or a short-term pullback.
The New Trade Plan: A Bearish Setup
The chart now displays a new short position setup. This is a bearish, counter-trend trade designed to profit from a potential price rejection.
Strategy: To sell or "short" Bitcoin at a higher price, anticipating a pullback. This is a riskier strategy than trading with the trend, but it's based on the idea that the sharp rally is due for a correction.
The Setup is as follows:
Entry (Sell): $120,222.31
Take Profit (Target): $119,323.25
Stop-Loss (Invalidation): $120,579.09
In summary, after the breakout rally, the plan is to watch for signs of exhaustion. If the price pushes up to the $120,222 level and gets rejected, this trade aims to capture the resulting downward move towards the $119,300 area. The stop-loss is placed tightly above to manage risk in case the powerful uptrend continues without pausing
Related publications
Disclaimer
The information and publications are not meant to be, and do not constitute, financial, investment, trading, or other types of advice or recommendations supplied or endorsed by TradingView. Read more in the Terms of Use.
Related publications
Disclaimer
The information and publications are not meant to be, and do not constitute, financial, investment, trading, or other types of advice or recommendations supplied or endorsed by TradingView. Read more in the Terms of Use.