
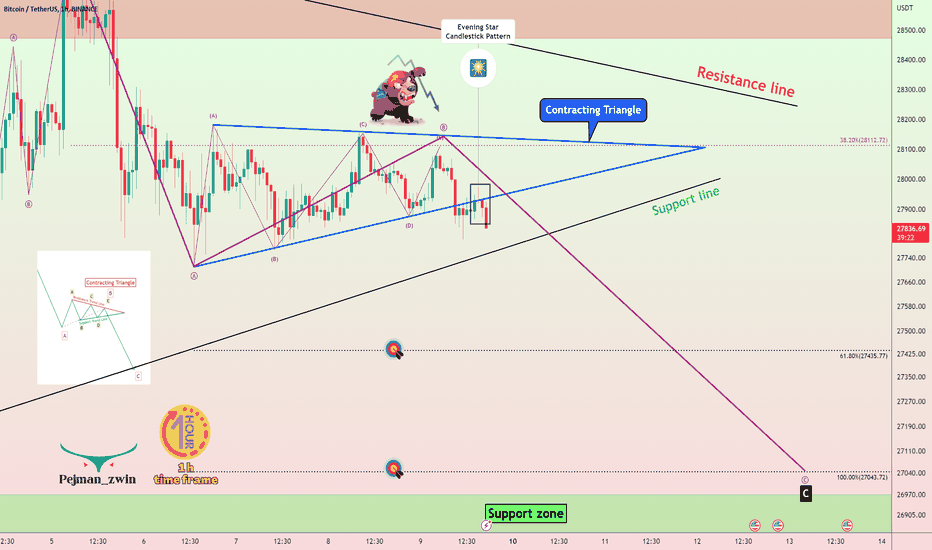
While Bitcoin seems to be completing Wave B, or even past it, there is a possibility that wave B may follow higher Fibonacci levels or even form a contracting triangle pattern.
At the same time, Bitcoin managed to form a symmetrical triangle pattern in the RSI indicator in the 4-hour time frame, which can be considered as a key for the next big move.👇

I expect Bitcoin to decline toward the 🟢support zone (26,980-26,580)🟢 after breaking the support line.
❗️Note❗️: If BTC goes over 29230 Scenario will change.
Bitcoin Analyze ( BTCUSDT ), 1-hour time frame ⏰.
Do not forget to put Stop loss for your positions (For every position you want to open).
Please follow your strategy, this is just my Idea, and I will be glad to see your ideas in this post.
Please do not forget the ✅' like'✅ button 🙏😊 & Share it with your friends; thanks, and Trade safe.
At the same time, Bitcoin managed to form a symmetrical triangle pattern in the RSI indicator in the 4-hour time frame, which can be considered as a key for the next big move.👇
I expect Bitcoin to decline toward the 🟢support zone (26,980-26,580)🟢 after breaking the support line.
❗️Note❗️: If BTC goes over
Bitcoin Analyze ( BTCUSDT ), 1-hour time frame ⏰.
Do not forget to put Stop loss for your positions (For every position you want to open).
Please follow your strategy, this is just my Idea, and I will be glad to see your ideas in this post.
Please do not forget the ✅' like'✅ button 🙏😊 & Share it with your friends; thanks, and Trade safe.
Note
Microwave B = Contracting triangle patternNote
🎁Welcome than a 50% bonus(Low Spread)👉vtm.pro/Y3AV7r
🎁Get a 20% Discount on your trading FEE on BYBIT:👉partner.bybit.com/b/PEJMANZWIN
🎁Get a 20% Bonus & 30% Discount on LBANK exchange(NO KYC)👉lbank.one/join/uBythQd
🎁Get a 20% Discount on your trading FEE on BYBIT:👉partner.bybit.com/b/PEJMANZWIN
🎁Get a 20% Bonus & 30% Discount on LBANK exchange(NO KYC)👉lbank.one/join/uBythQd
Related publications
Disclaimer
The information and publications are not meant to be, and do not constitute, financial, investment, trading, or other types of advice or recommendations supplied or endorsed by TradingView. Read more in the Terms of Use.