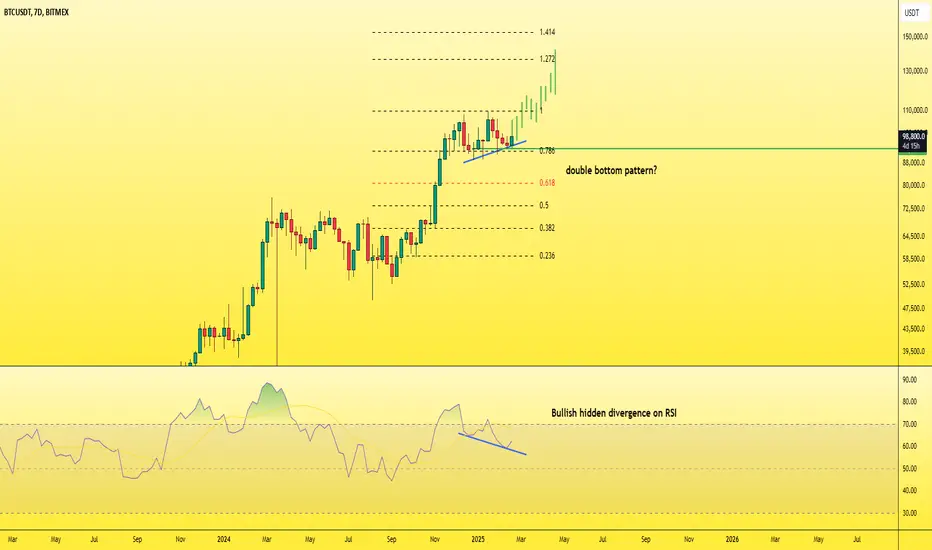
The weekly chart is bullish for Bitcoin.
It shows a hidden bullish divergence on RSI, indicating that the price trend is likely to continue upward.
Additionally, the chart highlights a double bottom pattern on HTF.
Bitcoin maintaining support at 0.786 Fibonacci will give it the momentum needed to create a new high.
A new all-time high (ATH) for Bitcoin is expected in the coming weeks.
Best regards Ceciliones🎯
🔻 free crypto signals🔻
t.me/itradeoncrypto
We're confident in our premium service — if you don't recover your subscription fee within 48 hours, we'll refund you.🎯
Message me on Telegram for full details.
t.me/Cecilion1
t.me/itradeoncrypto
We're confident in our premium service — if you don't recover your subscription fee within 48 hours, we'll refund you.🎯
Message me on Telegram for full details.
t.me/Cecilion1
Disclaimer
The information and publications are not meant to be, and do not constitute, financial, investment, trading, or other types of advice or recommendations supplied or endorsed by TradingView. Read more in the Terms of Use.