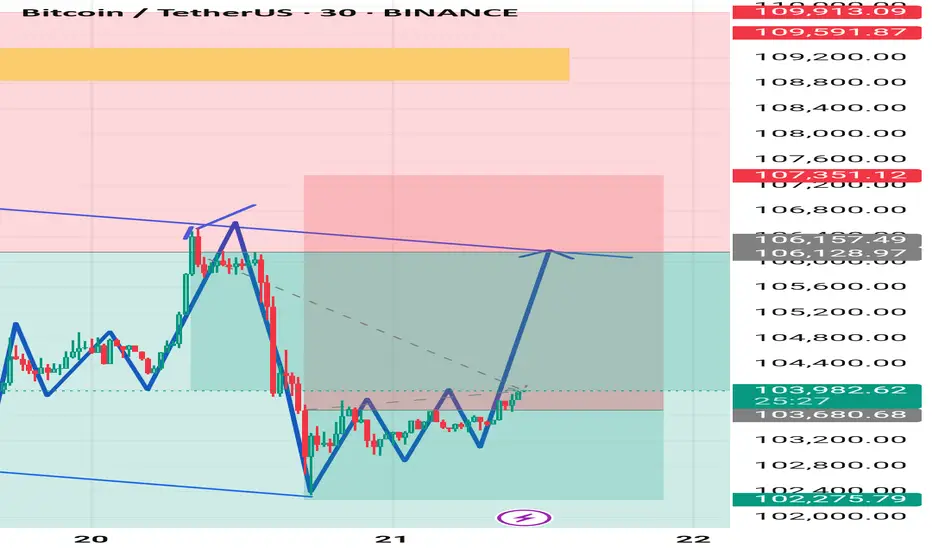
This chart is a 30-minute BTC/USDT (Bitcoin/Tether) technical analysis from Binance, showing a potential bullish setup. Here's a breakdown of the key elements:
1. Descending Broadening Wedge
The blue trendlines forming a broadening wedge indicate a reversal pattern.
Price has been moving within this structure and recently broke out from the bottom back toward the upper resistance line.
This pattern typically ends with a bullish breakout, especially after consolidation near the lower boundary.
2. Key Zones
Support Zone: Around $102,275 – $103,680 (light green zone).
Resistance Zone: Between $106,128 – $107,351 (light red zone), with an extended resistance up to ~$109,591 (dark red line).
3. Pattern Suggestion
The blue zigzag lines suggest a possible Inverse Head and Shoulders pattern near the current price area, indicating a bullish reversal.
A projected price path (in dotted grey) hints at a bullish move targeting the upper trendline near $106,128–$106,157, potentially a 16th–21st June breakout setup.
4. Price Action
Current price: $103,982.63, with moderate momentum (+0.66%).
The arrow projection suggests a bullish move targeting the upper resistance zone.
---
Summary:
Bias: Bullish short-term outlook.
Target Zone: $106,100–$107,300.
Invalidation: Drop below $102,275 may negate the bullish setup.
Let me know if you'd like an entry/exit plan, risk/reward analysis, or a trading strategy based on this setup.
t.me/+EQ88IkMSUvQwMGJk
Join telegram channel free
t.me/+EQ88IkMSUvQwMGJk
Join telegram channel free
t.me/+EQ88IkMSUvQwMGJk
Disclaimer
The information and publications are not meant to be, and do not constitute, financial, investment, trading, or other types of advice or recommendations supplied or endorsed by TradingView. Read more in the Terms of Use.
t.me/+EQ88IkMSUvQwMGJk
Join telegram channel free
t.me/+EQ88IkMSUvQwMGJk
Join telegram channel free
t.me/+EQ88IkMSUvQwMGJk
Disclaimer
The information and publications are not meant to be, and do not constitute, financial, investment, trading, or other types of advice or recommendations supplied or endorsed by TradingView. Read more in the Terms of Use.