🧠 Key Observations (Smart Money Concepts - SMC Style)
🔄 Market Structure:
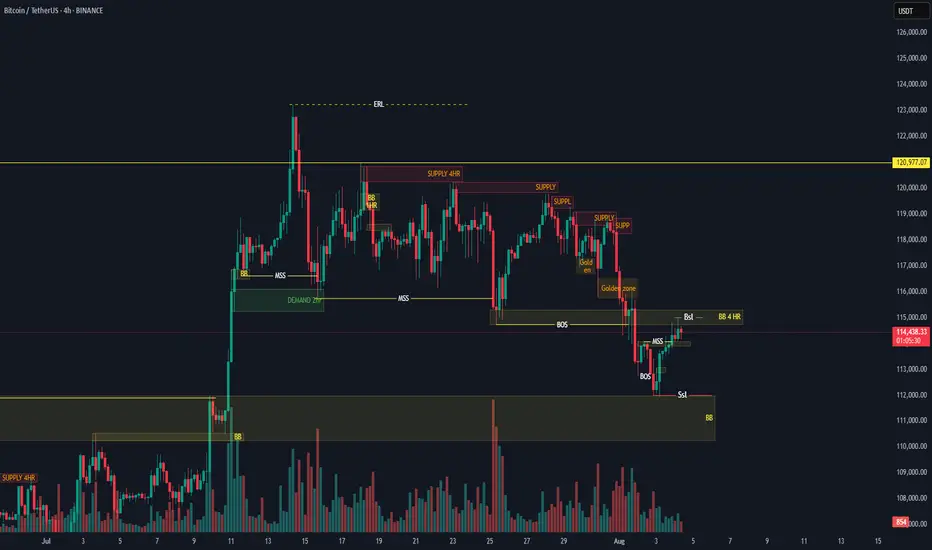
MSS (Market Structure Shift): Price recently made a MSS after a BOS (Break of Structure), indicating a shift to bullish structure.
BOS (Break of Structure): Seen on the move up from the demand zone.
SSL (Sell-side Liquidity) taken before the recent bullish move — classic liquidity sweep behavior.
📦 Zones:
Demand Zone: Between ~$111,000 and ~$113,000
4HR Supply Zone: Around ~$115,000 to ~$116,000 — where price is currently reacting.
Golden Zone (Entry/POI): Near the origin of the move that caused the BOS.
📍 Entry & TP/SL Setup:
Buy Limit: Placed at 111,931.32, right at the edge of the demand block.
Stop Loss (SL): Set just below at 110,453.42
Take Profit (TP): Targeting 113,676.39, right before the next resistance.
📊 Volume Analysis:
Large bullish volume spike aligns with the most recent BOS.
Diminishing sell volume during retracement suggests exhaustion of bearish momentum.
✅ Trade Idea (Based on Chart Setup):
Bias: Bullish
Entry: 111,931.32 USDT
Stop Loss: 110,453.42 USDT
Take Profit: 113,676.39 USDT
Risk/Reward: ~1:1.5 to 1:2
🔍 Additional Notes:
Liquidity Sweep: SSL cleared → indicates potential for long setups.
BOS + MSS Confluence: Bullish intent confirmed.
BB (Break of Block): Indicates intent to move higher if resistance is broken.
ERL Target: Final target is shown far above current price, near 123,280.88, could be a longer-term swing target if price holds structure.
🔄 Next Steps (as per typical TradingView publish ideas):
Set alerts at the demand zone.
Monitor price action when it taps into the Buy Limit level.
Watch for confirmation candle or volume spike before manual execution (if not using limit orders)
🔄 Market Structure:
MSS (Market Structure Shift): Price recently made a MSS after a BOS (Break of Structure), indicating a shift to bullish structure.
BOS (Break of Structure): Seen on the move up from the demand zone.
SSL (Sell-side Liquidity) taken before the recent bullish move — classic liquidity sweep behavior.
📦 Zones:
Demand Zone: Between ~$111,000 and ~$113,000
4HR Supply Zone: Around ~$115,000 to ~$116,000 — where price is currently reacting.
Golden Zone (Entry/POI): Near the origin of the move that caused the BOS.
📍 Entry & TP/SL Setup:
Buy Limit: Placed at 111,931.32, right at the edge of the demand block.
Stop Loss (SL): Set just below at 110,453.42
Take Profit (TP): Targeting 113,676.39, right before the next resistance.
📊 Volume Analysis:
Large bullish volume spike aligns with the most recent BOS.
Diminishing sell volume during retracement suggests exhaustion of bearish momentum.
✅ Trade Idea (Based on Chart Setup):
Bias: Bullish
Entry: 111,931.32 USDT
Stop Loss: 110,453.42 USDT
Take Profit: 113,676.39 USDT
Risk/Reward: ~1:1.5 to 1:2
🔍 Additional Notes:
Liquidity Sweep: SSL cleared → indicates potential for long setups.
BOS + MSS Confluence: Bullish intent confirmed.
BB (Break of Block): Indicates intent to move higher if resistance is broken.
ERL Target: Final target is shown far above current price, near 123,280.88, could be a longer-term swing target if price holds structure.
🔄 Next Steps (as per typical TradingView publish ideas):
Set alerts at the demand zone.
Monitor price action when it taps into the Buy Limit level.
Watch for confirmation candle or volume spike before manual execution (if not using limit orders)
Disclaimer
The information and publications are not meant to be, and do not constitute, financial, investment, trading, or other types of advice or recommendations supplied or endorsed by TradingView. Read more in the Terms of Use.
Disclaimer
The information and publications are not meant to be, and do not constitute, financial, investment, trading, or other types of advice or recommendations supplied or endorsed by TradingView. Read more in the Terms of Use.