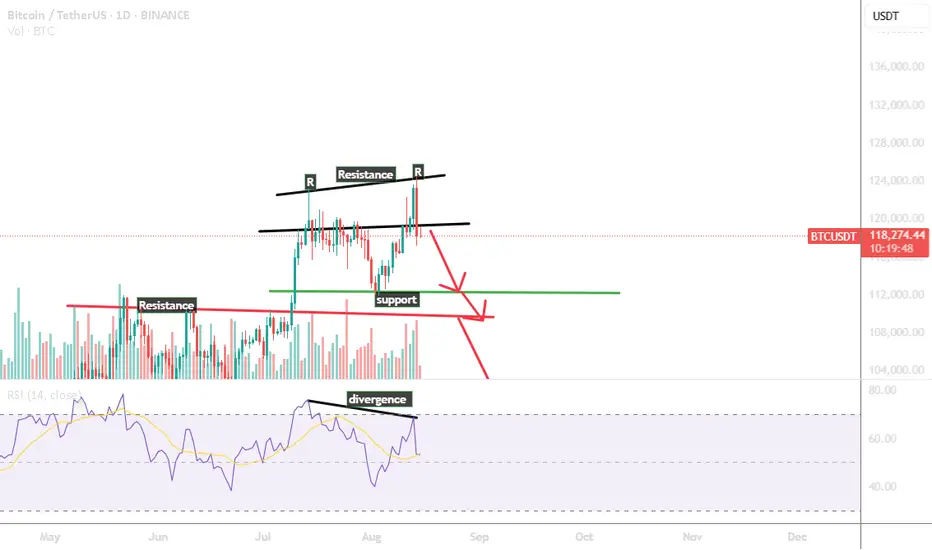
The chart is showing what looks like a double top pattern at the recent highs (~118k–120k USDT), marked by two "R" resistance points.
The neckline is roughly around the 112k zone (green support line).
A confirmed breakdown below this neckline could activate the double top target, pushing price lower.
2. RSI Divergence
There’s a bearish divergence — price made a higher high, but RSI made a lower high.
This signals weakening bullish momentum and increases the probability of a pullback.
3. Support & Resistance Zones
Immediate resistance: 118k–120k
Immediate support: 112k (neckline)
Next major support: ~104k (previous range support), and then ~96k if selling intensifies.
4 Possible Scenarios
Bearish: If BTC closes below 112k with volume, it may head toward 104k, possibly even 96k.
Bullish invalidation: A strong daily close above 120k with increasing volume could negate the bearish setup and lead to new highs.
The second push to resistance faced a strong rejection, completing a double top pattern.
This rejection, combined with high bearish volume, strongly signals downside momentum.
The setup confirms a likely move to lower price levels in the near term.
Disclaimer
The information and publications are not meant to be, and do not constitute, financial, investment, trading, or other types of advice or recommendations supplied or endorsed by TradingView. Read more in the Terms of Use.
Disclaimer
The information and publications are not meant to be, and do not constitute, financial, investment, trading, or other types of advice or recommendations supplied or endorsed by TradingView. Read more in the Terms of Use.