📈 Bitcoin (BTC/USDT) Technical Analysis | Double Resistance Zone – Breakout or Rejection?
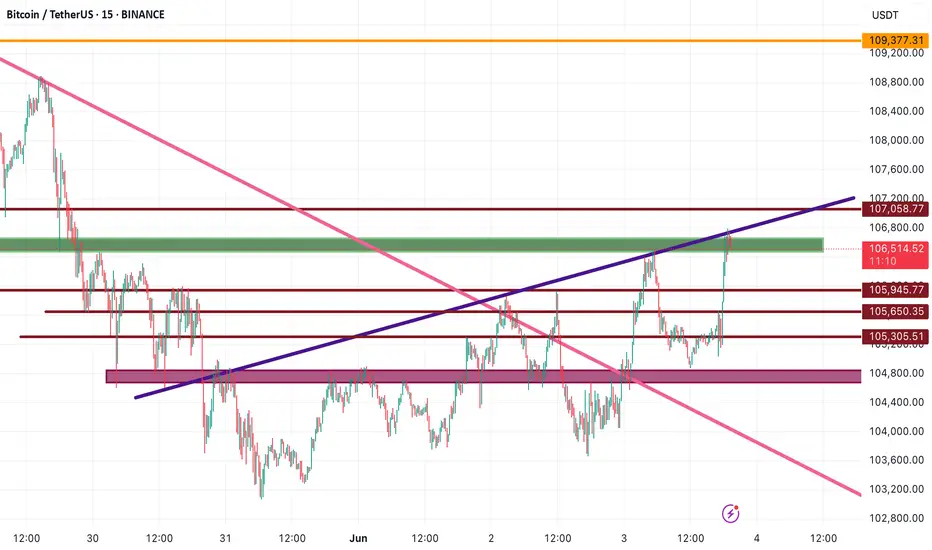
As expected, Bitcoin broke out of the descending trendline (pink) with strong momentum and is now facing a major confluence zone — where both a horizontal resistance and a diagonal trendline (purple) intersect. This level is highly critical and could determine the next directional move.
🟢 Bullish Scenario: Clean Break = Next Rally
If BTC manages to break and hold above this double resistance, we could see a push toward the next key targets:
$107,058 – major horizontal resistance
$107,608 – next short-term target if bullish momentum continues
Breaking these levels may open the path toward the psychological $109,377 zone.
🔻 Bearish Scenario: Rejection and Pullback Risk
If BTC gets rejected from this zone and shows bearish price action (like rejection wicks or bearish engulfing), possible pullback targets include:
$106,354 – immediate support
$105,724 – key short-term demand zone
These levels may attract buyers — but only if confirmed by price structure and volume reaction.
📌 Final Take
Bitcoin is now testing a high-stakes resistance cluster. A breakout may fuel a new bullish leg, while a rejection could trigger a healthy correction. Don’t guess — wait for candlestick confirmation and volume reaction before entering.
🚨 Enjoy this chart? Follow me for daily clean setups, real-time analysis, and no-hype breakdowns.
🔔 Let’s stay ahead of the market together — one chart at a time. 💹✨
Disclaimer
The information and publications are not meant to be, and do not constitute, financial, investment, trading, or other types of advice or recommendations supplied or endorsed by TradingView. Read more in the Terms of Use.
Disclaimer
The information and publications are not meant to be, and do not constitute, financial, investment, trading, or other types of advice or recommendations supplied or endorsed by TradingView. Read more in the Terms of Use.