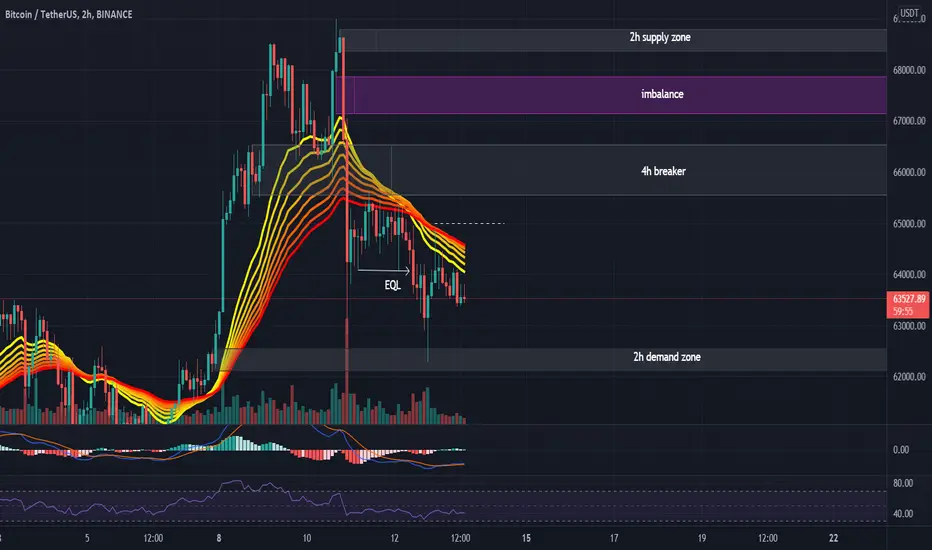
Analysis perfectly played out as shared yesterday and we predicted this retracement days ago. Price exactly tested the 2h demand zone at around the 62.2k level taking out the liquidity below the equal lows and got heavily rejected from there. MACD is showing very slow bullish momentum, however RSI and EMA ribbon are both showing bearish indications. Price is currently ranging in a downtrend but as long as the 2h demand zone is not broken we would still be looking at a new ATH sooner or later. It needs to reclaim the 65k level and break the previous high in order to continue with the bullish movements.
Disclaimer
The information and publications are not meant to be, and do not constitute, financial, investment, trading, or other types of advice or recommendations supplied or endorsed by TradingView. Read more in the Terms of Use.
Disclaimer
The information and publications are not meant to be, and do not constitute, financial, investment, trading, or other types of advice or recommendations supplied or endorsed by TradingView. Read more in the Terms of Use.