What you’re seeing
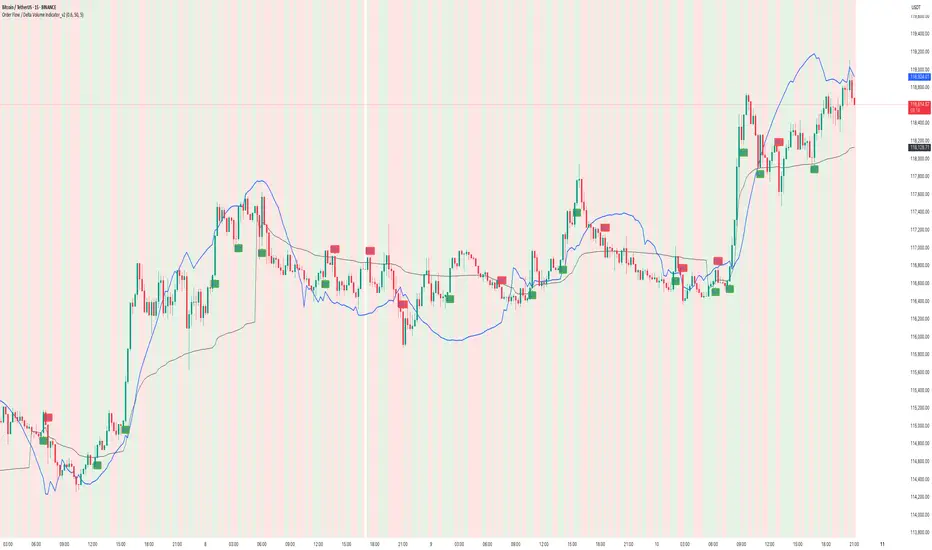
This idea visualizes an intraday session with my Order Flow / Delta Volume study applied. The chart overlays three things that matter for short-term context:
• Cumulative delta (blue line): running sum of delta, rescaled so it’s easy to compare to price swings.
• VWAP (grey line): session anchor for bias and mean-reversion context.
Signal logic (kept simple & rule-based)
A bar is considered imbalanced when one side’s volume dominates the bar’s total volume.
• Imbalance: upVol / totalVol > 0.60 → buy-side imbalance; downVol / totalVol > 0.60 → sell-side imbalance.
• Trend/strength filters (optional but enabled here):
• VWAP filter → longs only when price > VWAP; shorts only when price < VWAP.
• RSI(14) filter → longs only if RSI > 50; shorts only if RSI < 50.
• Noise throttle: minimum 5 bars between signals + price must exceed the prior close by ±ATR(14) to avoid tiny wiggles.
These rules try to capture moments when flow (delta) and context (VWAP/RSI) line up, while the ATR and cooldown help skip low-quality, back-to-back prints.
How to read the chart
• Rising blue cumulative-delta with price above VWAP → constructive backdrop for longs; fading/ranging delta warns to de-risk or wait.
• Green “BUY” labels plot when a buy-side imbalance clears the filters; red “SELL” labels mark sell-side imbalances with bearish context.
• Background tints briefly highlight where the raw imbalance occurred (light green/red), even when a trade filter blocks a signal.
Walk-through of the attached example
• Trend leg after a base: cumulative delta turns up first and price reclaims VWAP → several filtered BUY signals print into the push; ATR gate avoids chasing the very first small upticks.
• Mid-session chop: delta flips around the zero line and price hovers near VWAP → far fewer signals; most imbalances are filtered out by RSI/VWAP or fail the ATR move requirement.
• Late expansion: a swift VWAP reclaim with strong positive delta → clustered BUY signals that track the follow-through, while opposing sell imbalances near VWAP are rejected by filters.
Inputs used on this chart
• Imbalance threshold: 0.60
• VWAP filter: On
• RSI filter: On, threshold 50
• Cooldown: 5 bars
• ATR length: 14
Notes
• This is not a trade recommendation. Signals highlight where participation leans, not certainty of direction.
• Best paired with your execution plan (risk unit, stop location, partials near prior S/R or VWAP).
• In fast spikes, delta can be extreme—ATR and the cooldown help, but slippage and whipsaws are always possible.
• For instruments with very low volume or during illiquid hours, consider raising the imbalance threshold or disabling signals altogether.
Takeaway
Order-flow imbalance by itself fires often; layering VWAP, RSI, and an ATR-based movement check concentrates signals to moments when both flow and context align. The attached session shows that behavior clearly: fewer prints in chop, more conviction when cumulative delta trends and price holds its side of VWAP.
Educational post for discussion only. No financial advice.
Thanks.
TradeTech Analysis
Telegram Channel - t.me/Tradetech2024
Youtube Channel - youtube.com/@TradeTechAnalysis
Website - tradetechanalysis.com/
TradeTech Analysis
Telegram Channel - t.me/Tradetech2024
Youtube Channel - youtube.com/@TradeTechAnalysis
Website - tradetechanalysis.com/
Disclaimer
The information and publications are not meant to be, and do not constitute, financial, investment, trading, or other types of advice or recommendations supplied or endorsed by TradingView. Read more in the Terms of Use.