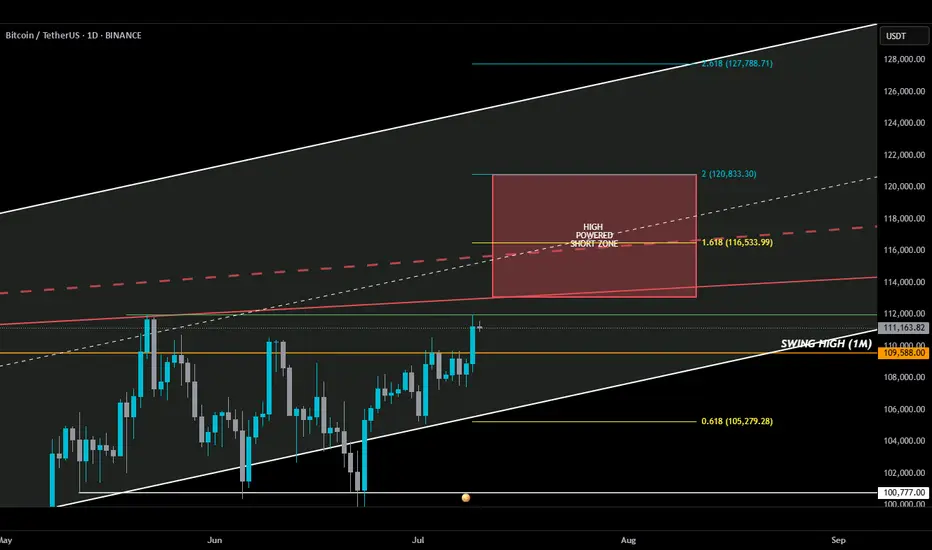
HIGH POWERED SHORT ZONE ⚡️
Usually, a 3% move doesn’t make anyone blink—but this one? It sent BTC into all-time high territory. I almost popped the champagne… until I remembered I’m in a short.
Not because I don’t believe in upside—but because my add zone in the HIGH POWERED SHORT ZONE hasn’t been tagged. Yet.
Here’s the breakdown 🧵👇
________________________________________
Before anyone goes bUCK wilD and cracks open that dusty bottle of Veuve, double-check something:
📅 The July 10th daily candle needs to close above the monthly swing high (orange line).
If BTC bulls lock that in, then a move deeper into the HIGH POWERED SHORT ZONE becomes real...
play-the-game real…
________________________________________
Where’s this HIGH POWERED SHORT ZONE coming from?
🔻 Solid red line – a trendline from Dec 2024 that has held strong through three separate tests — marking it as a key line on the sand.
🔻 Dashed red line – goes all the way back to Dec 2017. A seasoned veteran of resistance.
I also drew in a white ascending channel—not just for looks. If BTC breaks out, this channel will help us ask:
“How high is too high?”
________________________________________
Now enters Fibonacci — where nature maps out key alignments on the chart. 🌱
🟡 Gold lines = Fib golden ratios
🔵 Teal lines = Fib Degen Ratios
It’s wild how they just line up:
• 2.618? Right on the top of the channel.
• 1.618? Sitting on the 2017 trendline.
• 0.618? Near current support + bottom of the channel.
Also had to draw that horizontal support white line to keep an eye on.
A Bounce or bust? Ask the bUCKmOON!
Note
🩳ACTIVATED!Trade active
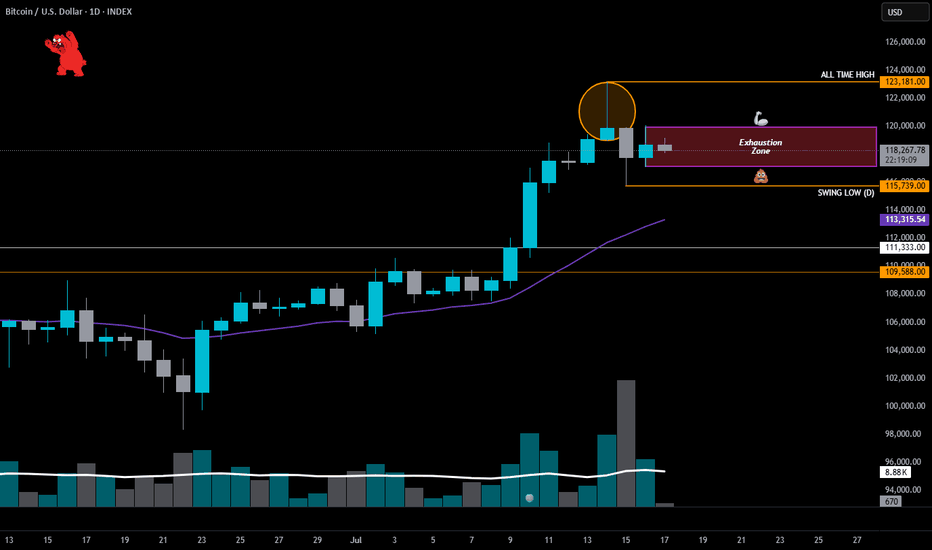
✅ Bullish Structure• Strong recovery candle off 116.5K
• RSI at 69 and rising → strong momentum, edging toward overbought
• Testing breakout from short-term range: 119.8K–120K
⚠️ Caution Flags
• Still inside “Exhaustion Zone”
• Small-bodied candles clustering → possible stall
• No volume surge yet → needs confirmation or this could be a lower high
📈 Bull Case: Needs breakout over $122.5k w/ volume soon
📉 Bear Case: Lose 117.2K = risk opens back to 115.5K
Note
BTC Exhaustion Zone UpdatePrice is coiling… but don’t confuse sideways with safety.
🔸 Range? Still here.
• BTC stuck in the “Exhaustion Zone” — $117.2K to $120K.
• Rejected again at $119.8K–$120.2K. That ceiling is getting crowded.
• Bounce off range low after dipping below — bulls defended… barely.
🔸 What’s New? Trendline Trouble.
• Descending resistance pressing down — lower highs stacking up.
• BTC now retesting that trendline. Will it break or buckle again?
📈 Short-Term Bias:
• Neutral-to-bullish above $117.8K
• Breakout = clear above trendline + $120K
• Breakdown = lose $117.2K → doors open to $115.7K
📉 Macro Bias:
• Neutral-while inside the range
• Daily close above $120.5K = breakout attempt
• Close below $117.2K = confirmed breakdown → $115K then $111K
—
📌 The Alpha View
Lower highs, descending resistance, and exhausted bulls = a pressure cooker.
When this coil snaps, it won’t knock — it’ll kick the door dOWN.
The High-Powered Short Zone is still alive and well.
Stay Sharp. Stack Sats… but maybe wait until after August 10th. 🧠⚔️🧊
For charts, market insight, and cycle patterns.
Follow on X: @TheAlphaView
🧠Stay Sharp! Stack Sats!🪙
Follow on X: @TheAlphaView
🧠Stay Sharp! Stack Sats!🪙
Disclaimer
The information and publications are not meant to be, and do not constitute, financial, investment, trading, or other types of advice or recommendations supplied or endorsed by TradingView. Read more in the Terms of Use.