Technical Analysis for Bitcoin (BTC/USDT) by Blaž Fabjan
Overview of Current Market Structure:
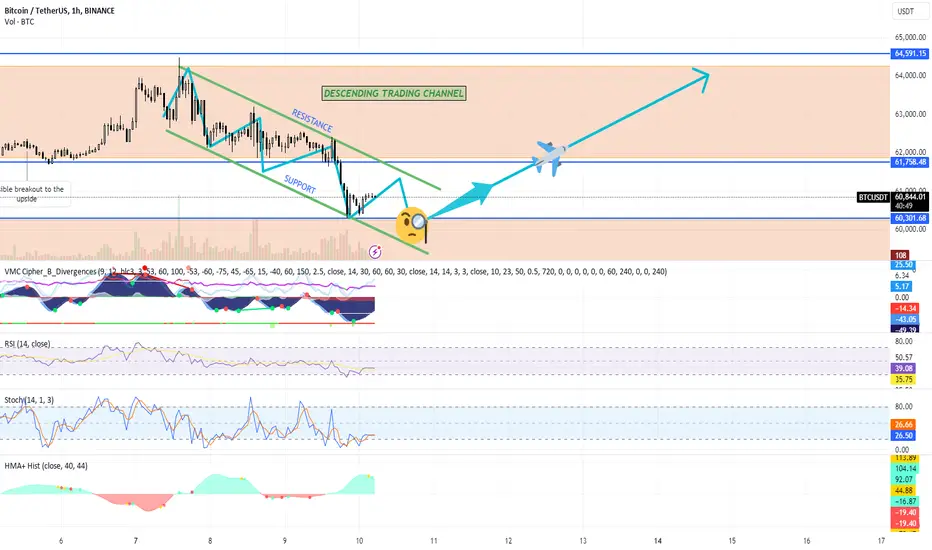
Descending Trading Channel: The Bitcoin price is currently trading within a descending channel, marked by parallel lines of resistance and support. The price has respected both boundaries and continues to oscillate between them.
Support: The current support level within the descending channel is approximately 60,000 USDT, as shown by the lower green line.
Resistance: The resistance level is around 61,758 USDT, as indicated by the upper green line.
Potential Breakout: A potential breakout to the upside is indicated by the analysis. If the price breaks through the resistance zone, we may see a rally towards the 64,591 USDT mark, which is a key resistance level in the broader time frame.
Indicators Analysis:
RSI (Relative Strength Index, 14 periods): The RSI is currently around 39.25, which indicates that the market is in a slightly oversold condition. This suggests a potential buying opportunity if momentum shifts to the upside.
Stochastic Oscillator (14, 3, 1): The stochastic oscillator shows a value of 27.09, signaling that the market is near the oversold region. A bullish crossover between the %K and %D lines could trigger an upward move.
VMC Cipher B Indicator (Divergences): The VMC Cipher B Divergences are currently showing bearish momentum, but the price appears to be bouncing off a significant support level. We are awaiting confirmation for a reversal.
HMA Histogram (40, 44): The HMA Histogram shows a value of 91.97 in the short term, indicating that bearish momentum is starting to slow, and a potential bullish reversal could occur soon.
Key Levels to Watch:
Immediate Support: The key support level lies around 60,000 USDT. If the price drops below this level, further bearish movement towards 58,000 USDT could be expected.
Immediate Resistance: Resistance stands at 61,758 USDT, the upper boundary of the descending channel. A breakout above this level could trigger a bullish rally.
Key Target Level: The next major target on a breakout would be the 64,591 USDT resistance, where the price is likely to face significant selling pressure.
Trading Plan:
Bullish Scenario:
Entry Point: Look for a breakout above the 61,758 USDT resistance level. Confirm the breakout with increasing volume and price closing above the channel.
First Target: 64,591 USDT, which is a major resistance zone in the upper range.
Stop Loss: Place the stop loss slightly below the support level of 60,000 USDT to manage downside risk.
Second Target (Aggressive): If bullish momentum continues, a potential extension towards 65,500 USDT is possible, aligning with previous highs.
Bearish Scenario:
Entry Point: If the price fails to break above the 61,758 USDT resistance level and starts rejecting at this point, consider a short position with a breakdown below the 60,000 USDT support.
First Target: A drop towards 58,000 USDT could be expected if bearish momentum accelerates.
Stop Loss: Set the stop loss above 62,000 USDT, just outside the resistance of the descending channel to account for volatility.
Neutral Scenario (Sideways Trading):
If the price consolidates between 60,000 and 61,758 USDT, wait for a clearer breakout or breakdown before entering any trades. The current channel suggests potential opportunities, but patience for confirmation is key.
Risk Management:
Position Size: Use proper risk management by not risking more than 1-2% of your capital on any trade.
Risk-Reward Ratio: Maintain a favorable risk-reward ratio of at least 1:2 or higher to ensure the profitability of your trades.
Overview of Current Market Structure:
Descending Trading Channel: The Bitcoin price is currently trading within a descending channel, marked by parallel lines of resistance and support. The price has respected both boundaries and continues to oscillate between them.
Support: The current support level within the descending channel is approximately 60,000 USDT, as shown by the lower green line.
Resistance: The resistance level is around 61,758 USDT, as indicated by the upper green line.
Potential Breakout: A potential breakout to the upside is indicated by the analysis. If the price breaks through the resistance zone, we may see a rally towards the 64,591 USDT mark, which is a key resistance level in the broader time frame.
Indicators Analysis:
RSI (Relative Strength Index, 14 periods): The RSI is currently around 39.25, which indicates that the market is in a slightly oversold condition. This suggests a potential buying opportunity if momentum shifts to the upside.
Stochastic Oscillator (14, 3, 1): The stochastic oscillator shows a value of 27.09, signaling that the market is near the oversold region. A bullish crossover between the %K and %D lines could trigger an upward move.
VMC Cipher B Indicator (Divergences): The VMC Cipher B Divergences are currently showing bearish momentum, but the price appears to be bouncing off a significant support level. We are awaiting confirmation for a reversal.
HMA Histogram (40, 44): The HMA Histogram shows a value of 91.97 in the short term, indicating that bearish momentum is starting to slow, and a potential bullish reversal could occur soon.
Key Levels to Watch:
Immediate Support: The key support level lies around 60,000 USDT. If the price drops below this level, further bearish movement towards 58,000 USDT could be expected.
Immediate Resistance: Resistance stands at 61,758 USDT, the upper boundary of the descending channel. A breakout above this level could trigger a bullish rally.
Key Target Level: The next major target on a breakout would be the 64,591 USDT resistance, where the price is likely to face significant selling pressure.
Trading Plan:
Bullish Scenario:
Entry Point: Look for a breakout above the 61,758 USDT resistance level. Confirm the breakout with increasing volume and price closing above the channel.
First Target: 64,591 USDT, which is a major resistance zone in the upper range.
Stop Loss: Place the stop loss slightly below the support level of 60,000 USDT to manage downside risk.
Second Target (Aggressive): If bullish momentum continues, a potential extension towards 65,500 USDT is possible, aligning with previous highs.
Bearish Scenario:
Entry Point: If the price fails to break above the 61,758 USDT resistance level and starts rejecting at this point, consider a short position with a breakdown below the 60,000 USDT support.
First Target: A drop towards 58,000 USDT could be expected if bearish momentum accelerates.
Stop Loss: Set the stop loss above 62,000 USDT, just outside the resistance of the descending channel to account for volatility.
Neutral Scenario (Sideways Trading):
If the price consolidates between 60,000 and 61,758 USDT, wait for a clearer breakout or breakdown before entering any trades. The current channel suggests potential opportunities, but patience for confirmation is key.
Risk Management:
Position Size: Use proper risk management by not risking more than 1-2% of your capital on any trade.
Risk-Reward Ratio: Maintain a favorable risk-reward ratio of at least 1:2 or higher to ensure the profitability of your trades.
Disclaimer
The information and publications are not meant to be, and do not constitute, financial, investment, trading, or other types of advice or recommendations supplied or endorsed by TradingView. Read more in the Terms of Use.
Disclaimer
The information and publications are not meant to be, and do not constitute, financial, investment, trading, or other types of advice or recommendations supplied or endorsed by TradingView. Read more in the Terms of Use.