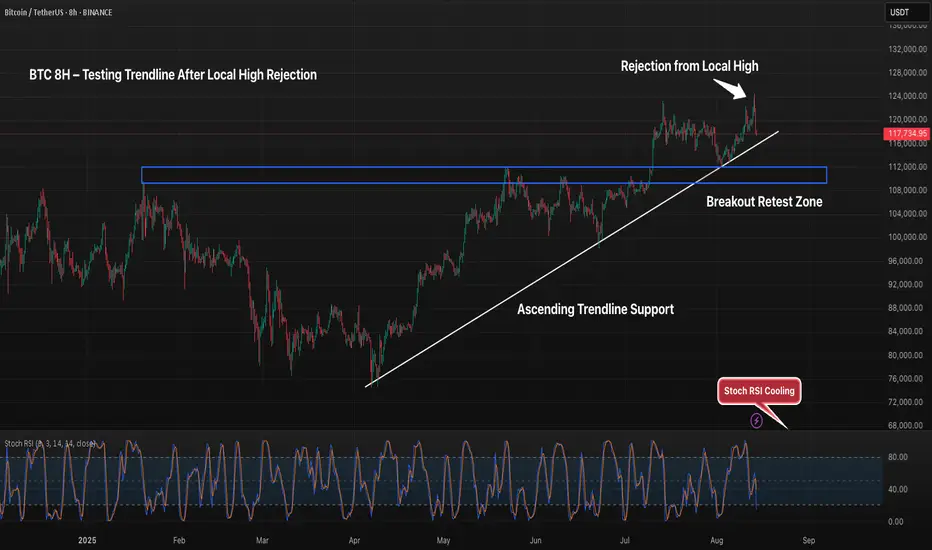
Bitcoin’s 8H chart shows price pulling back after rejecting near 124K, now retesting the ascending trendline from April. The key breakout retest zone sits between 110K–113K, offering a potential support area if the trendline fails. Stoch RSI is cooling from mid-range levels, suggesting momentum may shift before the next move. A bounce here could target recent highs, while a breakdown risks revisiting the prior support base.
Explore 5,000 Strategies at quanttradingpro.com
Search for the most profitable, lowest risk by symbol!
Search by indicators like Supertrend, Ichimoku, macd.
Join our discord discord.gg/2systG9frc
We provide education & tools.
Search for the most profitable, lowest risk by symbol!
Search by indicators like Supertrend, Ichimoku, macd.
Join our discord discord.gg/2systG9frc
We provide education & tools.
Disclaimer
The information and publications are not meant to be, and do not constitute, financial, investment, trading, or other types of advice or recommendations supplied or endorsed by TradingView. Read more in the Terms of Use.