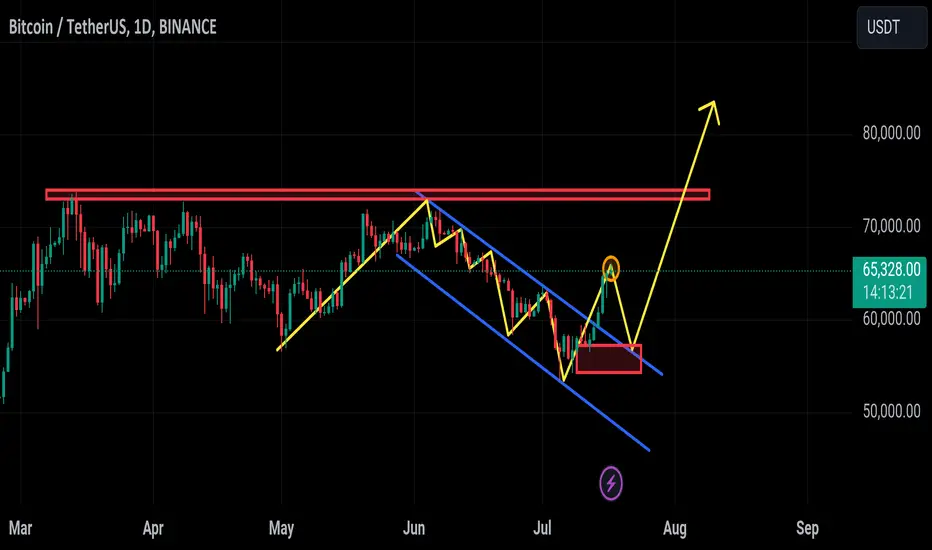
Bitcoin on the daily chart has formed a descending channel and is approaching a key resistance level. 📈BTC on the daily timeframe has been trading within a descending channel but has recently shown signs of bullish momentum. The price is currently testing the upper boundary of this channel around $65,300. If Bitcoin can break out of this descending channel, it could signal a strong bullish move.
Disclaimer
The information and publications are not meant to be, and do not constitute, financial, investment, trading, or other types of advice or recommendations supplied or endorsed by TradingView. Read more in the Terms of Use.
Disclaimer
The information and publications are not meant to be, and do not constitute, financial, investment, trading, or other types of advice or recommendations supplied or endorsed by TradingView. Read more in the Terms of Use.