Hi All,
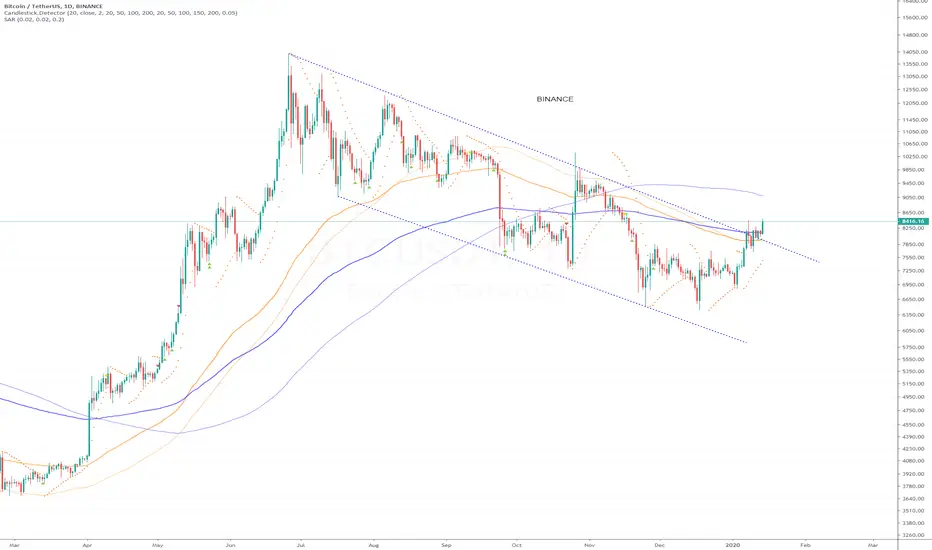
While I wait to see how this goes I thought it would be interesting to compare charts on the DAILY.
These are from all different exchanges (all the charts are listed at the end of this post)
The one thing that is confusing with all this, and its about the trend line.
People use the body or the wick of the candlesticks to establish the trend line.
The way I did it here on the DAILY, it shows that we consolidated outside the channel, which is a bullish indicator. WEEKLY I use the wicks.
The remaining of this post was drafted yesterday to provide the bullish evidence at the MACRO level. However I had a break...its been tough with lack of sleep, as I'm sure for many of you to crack this puzzle is important, as well as effort to protect you investment.
On this topic, I feel that the decision has been made to the upward side based on what I posted last (refer to my linked ideas on this post).
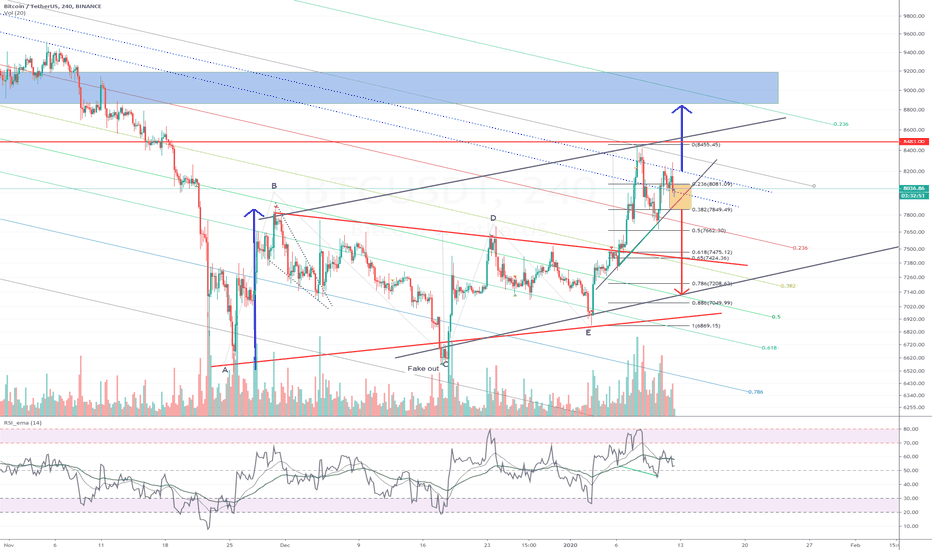
Current chart, potential to burst out.


++++++++++++++++++++++++++++++++++++++++++++++++++++++++++++++++++++++++++++++++++++++++++++++++++++++++++++++++++++++++++++++++++++++++++++++++++++++
**** YESTERDAYs DRAFT, the bullish perspective *****
Time to go long!!
Thoughts and observations:
** On the 2 day chart **
> Candlesticks > we have a hanging man indication (fyi my Candlestick detector script also has EMA\SMA built into it)
> We have RSI curving downwards however this could be a means for a bounce
> We have 1st rejection at the macro.upper channel (8400 range)
> We have most of the main EMAs below price (BULLISH)


** On the weekly chart **
> We have the 20 and 50 EMA below price (with 20 about to be above? when writing this)
> The main indicator on this one, the Parabolic SAR, with the weekly dot appearing indicating a change in trend


** On the 15 min chart **

> For more information at the micro level, refer to my previous post
++++++++++++++++++++++++++++++++++++++++++++++++++++++++++++++++++++++++++++++++++++++++++++++++++++++++++++++++++++++++++++++++++++++++++++++++++++++


While I wait to see how this goes I thought it would be interesting to compare charts on the DAILY.
These are from all different exchanges (all the charts are listed at the end of this post)
The one thing that is confusing with all this, and its about the trend line.
People use the body or the wick of the candlesticks to establish the trend line.
The way I did it here on the DAILY, it shows that we consolidated outside the channel, which is a bullish indicator. WEEKLY I use the wicks.
The remaining of this post was drafted yesterday to provide the bullish evidence at the MACRO level. However I had a break...its been tough with lack of sleep, as I'm sure for many of you to crack this puzzle is important, as well as effort to protect you investment.
On this topic, I feel that the decision has been made to the upward side based on what I posted last (refer to my linked ideas on this post).
Current chart, potential to burst out.
++++++++++++++++++++++++++++++++++++++++++++++++++++++++++++++++++++++++++++++++++++++++++++++++++++++++++++++++++++++++++++++++++++++++++++++++++++++
**** YESTERDAYs DRAFT, the bullish perspective *****
Time to go long!!
Thoughts and observations:
** On the 2 day chart **
> Candlesticks > we have a hanging man indication (fyi my Candlestick detector script also has EMA\SMA built into it)
> We have RSI curving downwards however this could be a means for a bounce
> We have 1st rejection at the macro.upper channel (8400 range)
> We have most of the main EMAs below price (BULLISH)
** On the weekly chart **
> We have the 20 and 50 EMA below price (with 20 about to be above? when writing this)
> The main indicator on this one, the Parabolic SAR, with the weekly dot appearing indicating a change in trend
** On the 15 min chart **
> For more information at the micro level, refer to my previous post
++++++++++++++++++++++++++++++++++++++++++++++++++++++++++++++++++++++++++++++++++++++++++++++++++++++++++++++++++++++++++++++++++++++++++++++++++++++
Note
Current resistance (always another level in a channel)Note
Pattern at the mini level confirmedNote
Part of my complete chart, micro level, 1 hrly chart (Large screen capture)Note
Some Fibonacci targetsNote
Another piece of evidence of the bullish trend, ichimoku resistance cloud on the daily has been broken as well as the Signal has moved away from the bottom of the --ve range. Currently at 4.. Obviously there are many resistance on the way up, which the 2D chart shows.Note
Why the 8500 is a strong resistance.Weekly chart with ichimoku settings. Note the MACD curving up. If it passes the zero level, I would imagine it will get the bystanders in.
Next resistance is 9K.
Note
Note
Updated my macro chart and looking for the main resistance range.Hence we should see at least one touch, rejected and then potential go to the bottom trend lines.
My macro chart
Note
A fractural that tells us we will be consolidating here for a short period before we break outDiscord: discord.com/invite/vb4hbP88vb (TradeToProspa)
Telegram: t.me/TprospaTradersbot
This community has signals now but with no risk management comms.
Telegram: t.me/TprospaTradersbot
This community has signals now but with no risk management comms.
Related publications
Disclaimer
The information and publications are not meant to be, and do not constitute, financial, investment, trading, or other types of advice or recommendations supplied or endorsed by TradingView. Read more in the Terms of Use.
Discord: discord.com/invite/vb4hbP88vb (TradeToProspa)
Telegram: t.me/TprospaTradersbot
This community has signals now but with no risk management comms.
Telegram: t.me/TprospaTradersbot
This community has signals now but with no risk management comms.
Related publications
Disclaimer
The information and publications are not meant to be, and do not constitute, financial, investment, trading, or other types of advice or recommendations supplied or endorsed by TradingView. Read more in the Terms of Use.