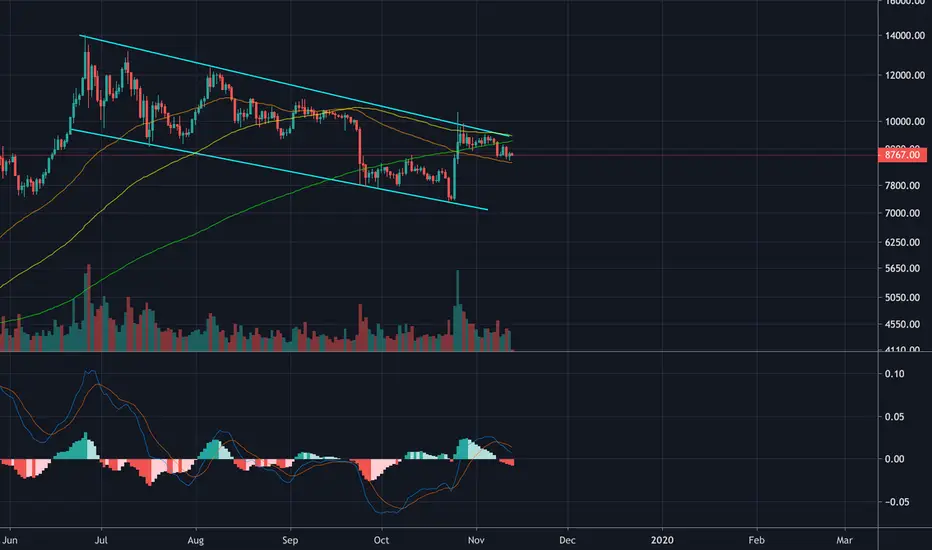
The LMACD indicator looks to be even more reliable on Bitcoin's logarithmic 1D chart. You can copy the script of the indicator here:
//version=3
study(title="Logarithmic Moving Average Convergence Divergence", shorttitle="LMACD")
// Getting inputs
fast_length = input(title="Fast Length", type=integer, defval=12)
slow_length = input(title="Slow Length", type=integer, defval=26)
src = input(title="Source", type=source, defval=close)
signal_length = input(title="Signal Smoothing", type=integer, minval = 1, maxval = 50, defval = 9)
sma_source = input(title="Simple MA(Oscillator)", type=bool, defval=false)
sma_signal = input(title="Simple MA(Signal Line)", type=bool, defval=false)
// Plot colors
col_grow_above = #26A69A
col_grow_below = #FFCDD2
col_fall_above = #B2DFDB
col_fall_below = #EF5350
col_macd = #0094ff
col_signal = #ff6a00
// Calculating
fast_ma = sma_source ? sma(src, fast_length) : ema(src, fast_length)
slow_ma = sma_source ? sma(src, slow_length) : ema(src, slow_length)
lmacd = log(fast_ma) - log(slow_ma)
signal = sma_signal ? sma(lmacd, signal_length) : ema(lmacd, signal_length)
hist = lmacd - signal
plot(hist, title="Histogram", style=columns, color=(hist>=0 ? (hist[1] < hist ? col_grow_above : col_fall_above) : (hist[1] < hist ? col_grow_below : col_fall_below) ), transp=0 )
plot(lmacd, title="LMACD", color=col_macd, transp=0)
plot(signal, title="Signal", color=col_signal, transp=0)
🚀Stocks, options, crypto trade signals at:
TTTsignals.com
📺YouTube channel:
youtube.com/thetravelingcryp...
🗓Book a 1 on 1 session with me to learn TA, options trading, and more!
bit.ly/3suJBX1
TTTsignals.com
📺YouTube channel:
youtube.com/thetravelingcryp...
🗓Book a 1 on 1 session with me to learn TA, options trading, and more!
bit.ly/3suJBX1
Disclaimer
The information and publications are not meant to be, and do not constitute, financial, investment, trading, or other types of advice or recommendations supplied or endorsed by TradingView. Read more in the Terms of Use.