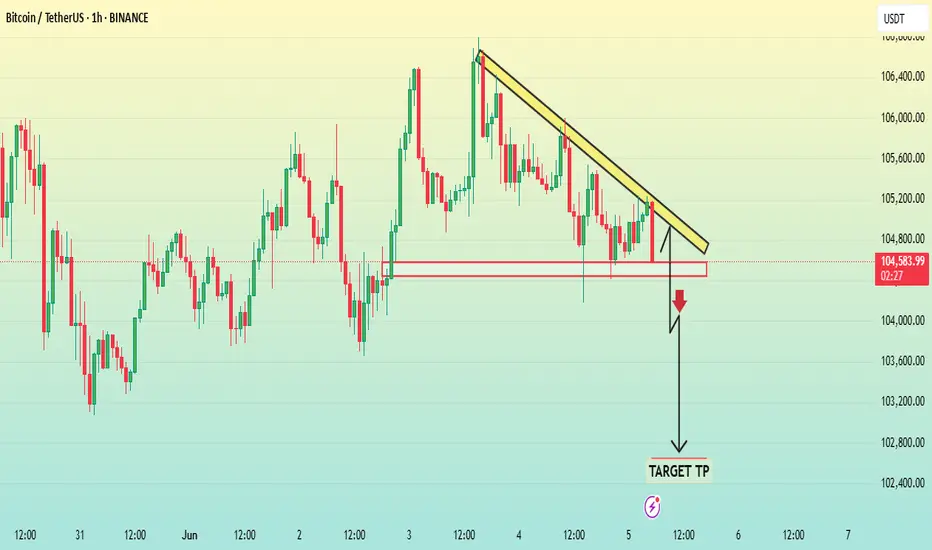
The second chart you uploaded is a 1-hour candlestick chart for Bitcoin (BTC/USDT) on Binance. Here's the analysis based on what is shown:
---
Chart Analysis:
1. Bearish Descending Triangle Pattern:
Descending resistance (yellow trendline) connects lower highs — indicating bearish pressure.
Horizontal support zone is marked in red, where price has repeatedly bounced — indicating strong support.
This setup forms a descending triangle, a bearish pattern that often results in a breakdown below support.
---
2. Breakdown Expectation:
A black arrow and zigzag line suggest a possible breakdown scenario.
The target TP (Take Profit) is drawn significantly below the current price, targeting near the $102,400–102,600 zone.
---
Implied Strategy:
Trigger for Entry (Short): A clear break and close below the horizontal red support zone (~$104,500).
Target TP: Around $102,400
Stop-Loss (not shown): Likely above the descending trendline, maybe near $105,200–105,300 to invalidate the pattern.
---
Technical Implication:
A descending triangle in this context suggests sellers are consistently pushing down while buyers are losing strength at the support level. A breakdown would confirm bearish control.
---
Would you like a comparison of this BTC setup vs. the SUI breakout chart in terms of trade setup strength or risk-reward?
---
Chart Analysis:
1. Bearish Descending Triangle Pattern:
Descending resistance (yellow trendline) connects lower highs — indicating bearish pressure.
Horizontal support zone is marked in red, where price has repeatedly bounced — indicating strong support.
This setup forms a descending triangle, a bearish pattern that often results in a breakdown below support.
---
2. Breakdown Expectation:
A black arrow and zigzag line suggest a possible breakdown scenario.
The target TP (Take Profit) is drawn significantly below the current price, targeting near the $102,400–102,600 zone.
---
Implied Strategy:
Trigger for Entry (Short): A clear break and close below the horizontal red support zone (~$104,500).
Target TP: Around $102,400
Stop-Loss (not shown): Likely above the descending trendline, maybe near $105,200–105,300 to invalidate the pattern.
---
Technical Implication:
A descending triangle in this context suggests sellers are consistently pushing down while buyers are losing strength at the support level. A breakdown would confirm bearish control.
---
Would you like a comparison of this BTC setup vs. the SUI breakout chart in terms of trade setup strength or risk-reward?
Trade active
TRADE ACTIVE TARGET TP HIT 220PIPSDisclaimer
The information and publications are not meant to be, and do not constitute, financial, investment, trading, or other types of advice or recommendations supplied or endorsed by TradingView. Read more in the Terms of Use.
Disclaimer
The information and publications are not meant to be, and do not constitute, financial, investment, trading, or other types of advice or recommendations supplied or endorsed by TradingView. Read more in the Terms of Use.