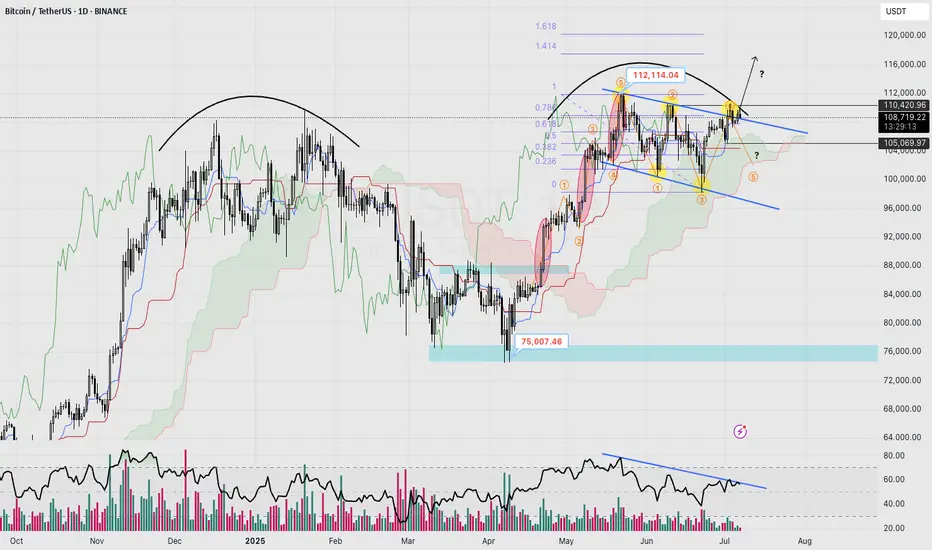
- Trend: BTC is currently trading within a short-term descending channel.
- Strong Resistance: Zone around $110k–112k, multiple failed retests observed.
- Key Support: Around $105k (Ichimoku Cloud upper edge & recent local bottom).
- RSI: Clear bearish divergence indicating weakening bullish momentum.
- Elliott Wave: Completed 5-wave impulse from $75k up to $112k, now correcting (likely waves 4-5 within the descending channel).
- Fibonacci: Breakout above $110k targets approximately $117k (1.414 Fib extension). Failure to break may lead price back down toward $102k.
Probability:
- Bullish scenario (35%): Clear breakout above $112k, targeting $117k.
- Bearish scenario (65%): Rejection at $112k, potential retest toward $105k → $102k.
⚠️ Recommendation: Closely watch the $110k zone. If BTC fails to clearly breakout, consider defensive actions (reducing position size, risk management).
Trade active
Signs of three consecutive lower highs are forming on Trade closed: target reached
10 July,Current outlook: There’s an 80% chance of a breakout at the $110k level.
I need to see two daily candles with strong volume—enough to surpass last week’s volume. If that happens and we get a weekly close above $112k next week, it would 100% confirm the next bullish leg, with the nearest target at $117.5k.
Of course, if this scenario plays out, the next likely setup is an upthrust—where price pushes to a new ATH. However, we’ll need to monitor this closely through the end of July before making any further calls.
Disclaimer
The information and publications are not meant to be, and do not constitute, financial, investment, trading, or other types of advice or recommendations supplied or endorsed by TradingView. Read more in the Terms of Use.
Disclaimer
The information and publications are not meant to be, and do not constitute, financial, investment, trading, or other types of advice or recommendations supplied or endorsed by TradingView. Read more in the Terms of Use.