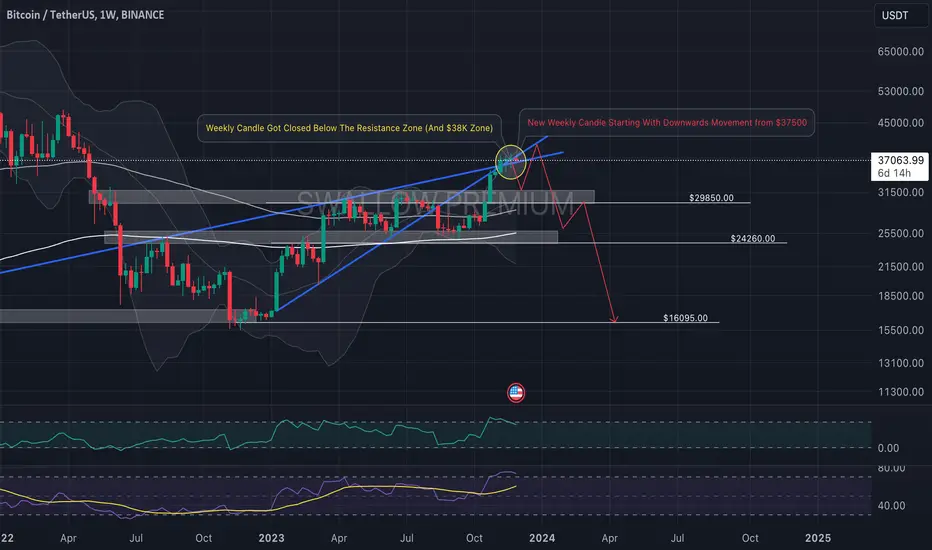
The weekly chart for Bitcoin shows that the price has failed to hold above the resistance zone and the $38K level, closing below both and indicating potential bearish momentum. A new week has begun with a move down from $37,500, suggesting that the bulls are losing their grip.
The $29,850 level is a significant point of interest; a fall to this support could signify a deeper correction. However, the $24,260 level stands out as a critical area to watch for a potential bounce or further breakdown. If the downtrend continues, the next target could be as low as $16,095, a crucial historical support zone.
The $29,850 level is a significant point of interest; a fall to this support could signify a deeper correction. However, the $24,260 level stands out as a critical area to watch for a potential bounce or further breakdown. If the downtrend continues, the next target could be as low as $16,095, a crucial historical support zone.
Note
BTC is still showing some weakness (on the daily timeframe as well) Seeing how price is rejecting that $38K zone multiple times shos us the sirge in downward movement here on coin!
🚨 Authentic Traders
⚡️ Short-Term + Mid-Term Trades
Keep an eye on us and you will not regret it. 😉
Telegram: t.me/+fiEDSn7M9pJkODA0
⚡️ Short-Term + Mid-Term Trades
Keep an eye on us and you will not regret it. 😉
Telegram: t.me/+fiEDSn7M9pJkODA0
Related publications
Disclaimer
The information and publications are not meant to be, and do not constitute, financial, investment, trading, or other types of advice or recommendations supplied or endorsed by TradingView. Read more in the Terms of Use.