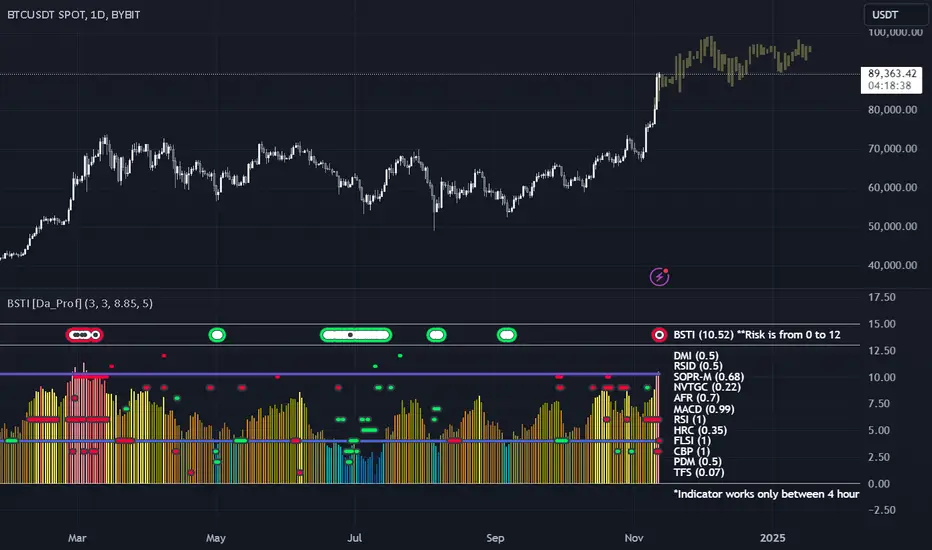
The BTSI has signaled a high risk area for BTC. These can happen and price can still go up for a while until a bear deviation. The bars pattern is what happened the last time.
Trade closed: target reached
This was a good call with exhaustion price action to the upside to follow, but months of sideways/down to follow. I've noticed that the BSTI hits a top signal and it take about a month for the price to stop going up. The upward price action during that month is at a shallower angle of attack...showing exhaustion. Something to consider for future triggers of the BSTI. Note
BTW...the fractal was nice :) Disclaimer
The information and publications are not meant to be, and do not constitute, financial, investment, trading, or other types of advice or recommendations supplied or endorsed by TradingView. Read more in the Terms of Use.
Disclaimer
The information and publications are not meant to be, and do not constitute, financial, investment, trading, or other types of advice or recommendations supplied or endorsed by TradingView. Read more in the Terms of Use.