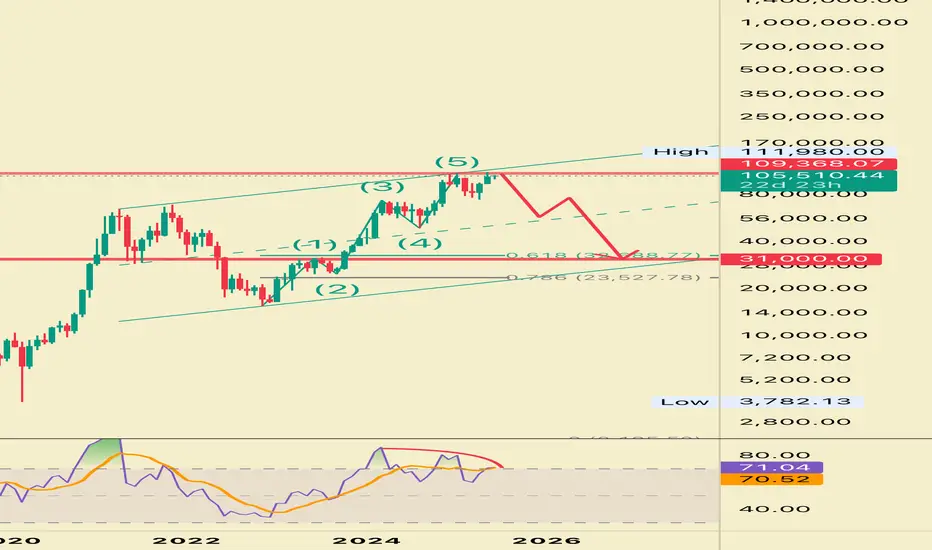
🔹 “This is Bitcoin on the 1-Month chart. What we see here is a completed 5-wave impulse according to Elliott Wave Theory.”
🔹 “Wave (1) through (5) is now complete, and the price has hit the upper boundary of a long-term ascending channel.”
🔹 “Notice this red zone? This is a strong resistance area between $76K and $111K. We might be forming a potential double top pattern here.”
🔹 “Divergence is likely forming in wave 5 — a classic sign of weakening momentum.”
🔹 “If we break below $66K and then $53K, expect a drop all the way to the $31K zone.”
🔹 “This level aligns with the bottom of the channel and possibly the 0.618 Fibonacci retracement.”
🔹 “Final target? $31,000 – a key zone for accumulation before the next major cycle.”
Disclaimer
The information and publications are not meant to be, and do not constitute, financial, investment, trading, or other types of advice or recommendations supplied or endorsed by TradingView. Read more in the Terms of Use.
Disclaimer
The information and publications are not meant to be, and do not constitute, financial, investment, trading, or other types of advice or recommendations supplied or endorsed by TradingView. Read more in the Terms of Use.