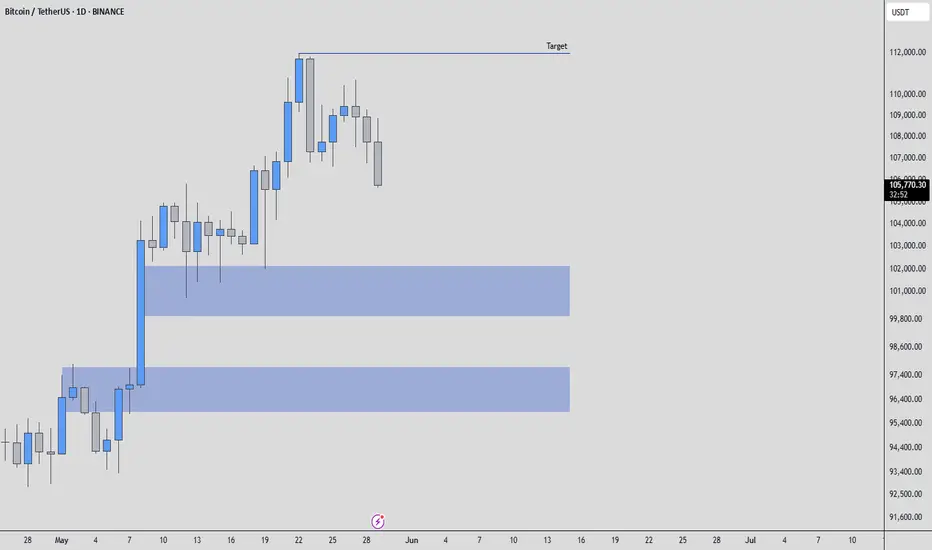
Taking a look at BTCUSDT. My analysis points to this current level as a significant support zone, with my overall target being higher.
While the low timeframe (LTF) action hasn't yet shown a strong influx of buyers, the picture on the higher timeframes is quite compelling. The upward movement we're seeing there is displaying solid support, indicating sustained buying interest at a larger scale.
This divergence between the LTF and HTF suggests a potential build-up of bullish momentum. We might see some consolidation or sideways movement on the lower timeframes as buyers accumulate before a more decisive push upwards.
As always, I'm keeping a close eye on the volume footprint. The sustained buying volume on the higher timeframes lends credence to this bullish outlook. I'll be waiting for the low timeframe to catch up, looking for those clear signs of buyer entry – breakouts above smaller resistances with increasing volume, and successful retests as support. CDV (Cumulative Delta Volume) on both timeframes will also be crucial in confirming this directional bias.
Remember, I focus on coins showing sudden and significant increases in volume, and while the immediate LTF might be quiet, the HTF volume profile is definitely noteworthy here.
My bias for BTCUSDT right now is upwards, given the supportive structure on the higher timeframes. However, as always, I'll be waiting for that low timeframe confirmation before considering any entries. Patience and confirmation are key, even when the higher timeframe picture looks promising. Let's see if the lower timeframes will soon echo the bullish intent we're seeing on the higher ones.
📌I keep my charts clean and simple because I believe clarity leads to better decisions.
📌My approach is built on years of experience and a solid track record. I don’t claim to know it all but I’m confident in my ability to spot high-probability setups.
📌If you would like to learn how to use the heatmap, cumulative volume delta and volume footprint techniques that I use below to determine very accurate demand regions, you can send me a private message. I help anyone who wants it completely free of charge.
🔑I have a long list of my proven technique below:
I stopped adding to the list because it's kinda tiring to add 5-10 charts in every move but you can check my profile and see that it goes on..
While the low timeframe (LTF) action hasn't yet shown a strong influx of buyers, the picture on the higher timeframes is quite compelling. The upward movement we're seeing there is displaying solid support, indicating sustained buying interest at a larger scale.
This divergence between the LTF and HTF suggests a potential build-up of bullish momentum. We might see some consolidation or sideways movement on the lower timeframes as buyers accumulate before a more decisive push upwards.
As always, I'm keeping a close eye on the volume footprint. The sustained buying volume on the higher timeframes lends credence to this bullish outlook. I'll be waiting for the low timeframe to catch up, looking for those clear signs of buyer entry – breakouts above smaller resistances with increasing volume, and successful retests as support. CDV (Cumulative Delta Volume) on both timeframes will also be crucial in confirming this directional bias.
Remember, I focus on coins showing sudden and significant increases in volume, and while the immediate LTF might be quiet, the HTF volume profile is definitely noteworthy here.
My bias for BTCUSDT right now is upwards, given the supportive structure on the higher timeframes. However, as always, I'll be waiting for that low timeframe confirmation before considering any entries. Patience and confirmation are key, even when the higher timeframe picture looks promising. Let's see if the lower timeframes will soon echo the bullish intent we're seeing on the higher ones.
📌I keep my charts clean and simple because I believe clarity leads to better decisions.
📌My approach is built on years of experience and a solid track record. I don’t claim to know it all but I’m confident in my ability to spot high-probability setups.
📌If you would like to learn how to use the heatmap, cumulative volume delta and volume footprint techniques that I use below to determine very accurate demand regions, you can send me a private message. I help anyone who wants it completely free of charge.
🔑I have a long list of my proven technique below:
- 🎯 ZENUSDT.P: Patience & Profitability | %230 Reaction from the Sniper Entry
- 🐶 DOGEUSDT.P: Next Move
- 🎨 RENDERUSDT.P: Opportunity of the Month
- 💎 ETHUSDT.P: Where to Retrace
- 🟢 BNBUSDT.P: Potential Surge
- 📊 BTC Dominance: Reaction Zone
- 🌊 WAVESUSDT.P: Demand Zone Potential
- 🟣 UNIUSDT.P: Long-Term Trade
- 🔵 XRPUSDT.P: Entry Zones
- 🔗 LINKUSDT.P: Follow The River
- 📈 BTCUSDT.P: Two Key Demand Zones
- 🟩 POLUSDT: Bullish Momentum
- 🌟 PENDLEUSDT.P: Where Opportunity Meets Precision
- 🔥 BTCUSDT.P: Liquidation of Highly Leveraged Longs
- 🌊 SOLUSDT.P: SOL's Dip - Your Opportunity
- 🐸 1000PEPEUSDT.P: Prime Bounce Zone Unlocked
- 🚀 ETHUSDT.P: Set to Explode - Don't Miss This Game Changer
- 🤖 IQUSDT: Smart Plan
- ⚡️ PONDUSDT: A Trade Not Taken Is Better Than a Losing One
- 💼 STMXUSDT: 2 Buying Areas
- 🐢 TURBOUSDT: Buy Zones and Buyer Presence
- 🌍 ICPUSDT.P: Massive Upside Potential | Check the Trade Update For Seeing Results
- 🟠 IDEXUSDT: Spot Buy Area | %26 Profit if You Trade with MSB
- 📌 USUALUSDT: Buyers Are Active + %70 Profit in Total
- 🌟 FORTHUSDT: Sniper Entry +%26 Reaction
- 🐳 QKCUSDT: Sniper Entry +%57 Reaction
- 📊 BTC.D: Retest of Key Area Highly Likely
- 📊 XNOUSDT %80 Reaction with a Simple Blue Box!
- 📊 BELUSDT Amazing %120 Reaction!
- 📊 Simple Red Box, Extraordinary Results
- 📊 TIAUSDT | Still No Buyers—Maintaining a Bearish Outlook
- 📊 OGNUSDT | One of Today’s Highest Volume Gainers – +32.44%
- 📊 TRXUSDT - I Do My Thing Again
I stopped adding to the list because it's kinda tiring to add 5-10 charts in every move but you can check my profile and see that it goes on..
Professional Day Trader
Microstructure Practicioner
t.me/umuttrades
kick.com/umuttrades live everyday.
Microstructure Practicioner
t.me/umuttrades
kick.com/umuttrades live everyday.
Related publications
Disclaimer
The information and publications are not meant to be, and do not constitute, financial, investment, trading, or other types of advice or recommendations supplied or endorsed by TradingView. Read more in the Terms of Use.