💀 Hey , how's it going ? Come over here — Satoshi got something for you !
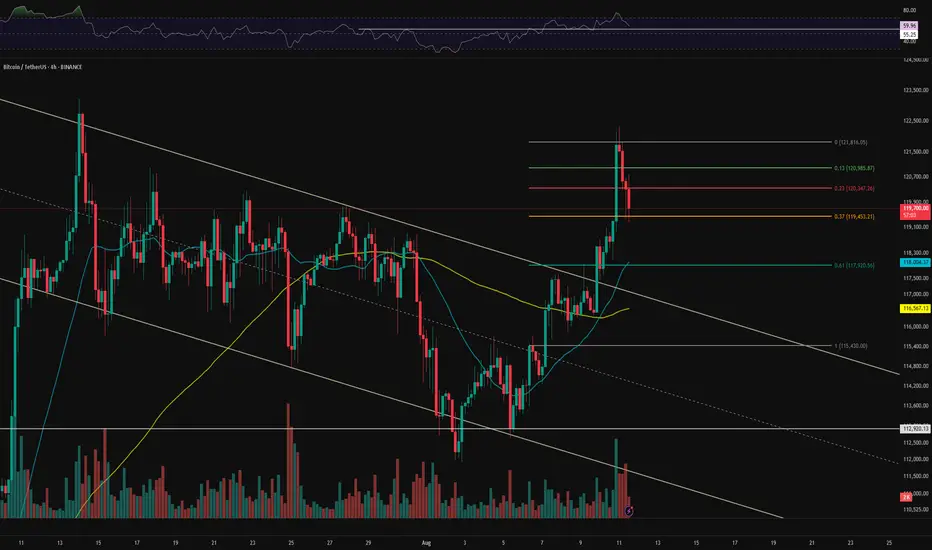
⏰ We’re analyzing BTC on the 4-hour timeframe , Bitcoin is pushing toward its all-time high with a massive, high-volume whale candle .
👀 After breaking through its resistance zones, Bitcoin surged toward its ATH but faced rejection and selling pressure near that level. Key potential support areas are the 25 and 99 moving averages, marked in yellow and sky blue on the chart. The 25 MA is close to the 0.61 Fibonacci level, around $118,000, and is moving toward the average of the last 25 candles. A reaction to this moving average could indicate whether Bitcoin will rebound or drop further .
⚙️ Bitcoin’s key RSI zone is at 55.25, which corresponds to the $118,000 range. Breaking below this could push RSI under 50 .
🎮 Fibonacci retracement drawn from the breakout and pullback of the V-pattern shows that the 0.13 and 0.23 levels failed under selling pressure, sending BTC toward lower support levels. The current support based on Fibonacci is at 0.37. If this is lost, BTC could range on the 4-hour chart between 0.37 and 0.61 .
✉️ Tomorrow at 8:30 AM New York time, the official CPI (Consumer Price Index) report will be released by the U.S. Bureau of Labor Statistics. This news can significantly impact the crypto market — if inflation decreases, purchasing power rises , and Bitcoin could set a new all-time high .
🕯 BTC trading volume and activity are strong in both directions. Each price surge is followed by a quicker consolidation, and corrections occur under selling pressure .
🔔 An alert zone is set at the 0.13 Fibonacci level to observe price behavior when it reaches that point, then decide on the best course of action .
📊 A break below Tether dominance at 4.10% would signal a long position on BTC, while a break above 4.20% could lead BTC into a deeper correction .
🖥 Summary : Tomorrow’s CPI news could spark large, powerful candles and potentially a new ATH for Bitcoin. If U.S. inflation increases, stronger selling pressure is possible. There’s no specific trigger for this current level, but breaking 0.13 will prompt me to open a position — or at least take trades on altcoins with a bullish correlation to Bitcoin .
Trade active
BTC has touched the 25 moving average, shown with the sky-blue range, which I’ve also marked using Fibonacci. Price action in this area is important.
join our Telegram channel for more insightful and educational content .
t.me/satoshiframetr
t.me/satoshiframetr
Related publications
Disclaimer
The information and publications are not meant to be, and do not constitute, financial, investment, trading, or other types of advice or recommendations supplied or endorsed by TradingView. Read more in the Terms of Use.