Technical Analysis for Bitcoin (BTC/USDT) by Blaž Fabjan
Descending Trading Channel:
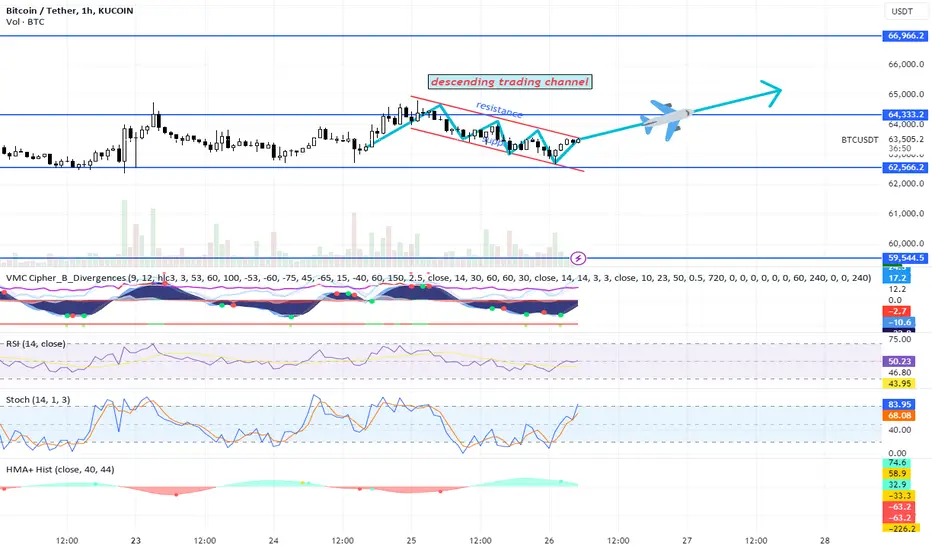
Bitcoin appears to be moving within a descending trading channel, with the price gradually testing the lower bounds and trying to break out from this downtrend.
The key resistance for a breakout from this descending channel is around the 64,000 USDT level, while the support is close to the 62,500 USDT level.
A breakout above the upper channel line would indicate a potential bullish reversal and continuation to the upside.
Resistance and Support Levels:
Resistance: The primary resistance zone is around 64,333 USDT (marked on the chart). A breakout above this level may result in the next target being around 66,966 USDT.
Support: The nearest support level is 62,566 USDT. A breakdown below this could push the price towards the lower support area around 59,544.5 USDT.
Momentum Indicators:
VMC Cipher B Divergences: This indicator is currently showing some positive momentum with green dots indicating potential bullish divergence, suggesting that the price may increase soon.
RSI (14, close): The RSI is hovering around 50, indicating neutral momentum. A break above 50 could indicate a bullish trend, while a drop below could signal a bearish continuation.
Stochastic Oscillator: The Stoch (14, 1, 3) shows an overbought condition at 82.78, which may suggest a short-term pullback or consolidation. However, if the upward trend continues, this can be ignored in favor of further bullish momentum.
HMA+ Histogram: The HMA+ (Hull Moving Average) is slightly bullish with a reading of 33.0, indicating that the short-term trend may be shifting toward the upside.
Volume:
The chart shows moderate volume. Higher volume accompanying a breakout above the resistance level will be crucial to confirm the move.
Trading Plan:
Bullish Scenario:
Entry: Consider entering a long position if Bitcoin breaks above 64,333 USDT with confirmed volume.
Target 1: The first target would be around 65,000 USDT.
Target 2: If momentum persists, the second target could be 66,966 USDT.
Stop Loss: Place a stop loss below the support at 62,500 USDT to manage risk.
Bearish Scenario:
Entry: If Bitcoin breaks below 62,566 USDT, consider entering a short position.
Target 1: The first target would be around 61,000 USDT.
Target 2: A further decline could push the price toward 59,544.5 USDT.
Stop Loss: Place a stop loss above the 64,333 USDT level to minimize potential losses.
Summary:
Bitcoin is currently at a pivotal point within a descending channel. If the price breaks above the key resistance at 64,333 USDT, there is potential for a bullish breakout targeting 66,966 USDT. However, if Bitcoin breaks down from the 62,566 USDT support, the bearish scenario could unfold, leading to a possible drop toward the 59,500 USDT zone. Monitoring volume and key indicators like RSI, Stochastic, and HMA+ will be important for confirming the direction.
Descending Trading Channel:
Bitcoin appears to be moving within a descending trading channel, with the price gradually testing the lower bounds and trying to break out from this downtrend.
The key resistance for a breakout from this descending channel is around the 64,000 USDT level, while the support is close to the 62,500 USDT level.
A breakout above the upper channel line would indicate a potential bullish reversal and continuation to the upside.
Resistance and Support Levels:
Resistance: The primary resistance zone is around 64,333 USDT (marked on the chart). A breakout above this level may result in the next target being around 66,966 USDT.
Support: The nearest support level is 62,566 USDT. A breakdown below this could push the price towards the lower support area around 59,544.5 USDT.
Momentum Indicators:
VMC Cipher B Divergences: This indicator is currently showing some positive momentum with green dots indicating potential bullish divergence, suggesting that the price may increase soon.
RSI (14, close): The RSI is hovering around 50, indicating neutral momentum. A break above 50 could indicate a bullish trend, while a drop below could signal a bearish continuation.
Stochastic Oscillator: The Stoch (14, 1, 3) shows an overbought condition at 82.78, which may suggest a short-term pullback or consolidation. However, if the upward trend continues, this can be ignored in favor of further bullish momentum.
HMA+ Histogram: The HMA+ (Hull Moving Average) is slightly bullish with a reading of 33.0, indicating that the short-term trend may be shifting toward the upside.
Volume:
The chart shows moderate volume. Higher volume accompanying a breakout above the resistance level will be crucial to confirm the move.
Trading Plan:
Bullish Scenario:
Entry: Consider entering a long position if Bitcoin breaks above 64,333 USDT with confirmed volume.
Target 1: The first target would be around 65,000 USDT.
Target 2: If momentum persists, the second target could be 66,966 USDT.
Stop Loss: Place a stop loss below the support at 62,500 USDT to manage risk.
Bearish Scenario:
Entry: If Bitcoin breaks below 62,566 USDT, consider entering a short position.
Target 1: The first target would be around 61,000 USDT.
Target 2: A further decline could push the price toward 59,544.5 USDT.
Stop Loss: Place a stop loss above the 64,333 USDT level to minimize potential losses.
Summary:
Bitcoin is currently at a pivotal point within a descending channel. If the price breaks above the key resistance at 64,333 USDT, there is potential for a bullish breakout targeting 66,966 USDT. However, if Bitcoin breaks down from the 62,566 USDT support, the bearish scenario could unfold, leading to a possible drop toward the 59,500 USDT zone. Monitoring volume and key indicators like RSI, Stochastic, and HMA+ will be important for confirming the direction.
Disclaimer
The information and publications are not meant to be, and do not constitute, financial, investment, trading, or other types of advice or recommendations supplied or endorsed by TradingView. Read more in the Terms of Use.
Disclaimer
The information and publications are not meant to be, and do not constitute, financial, investment, trading, or other types of advice or recommendations supplied or endorsed by TradingView. Read more in the Terms of Use.