Hello, traders!
Follow us to get the latest information quickly.
Have a great day!
-------------------------------------
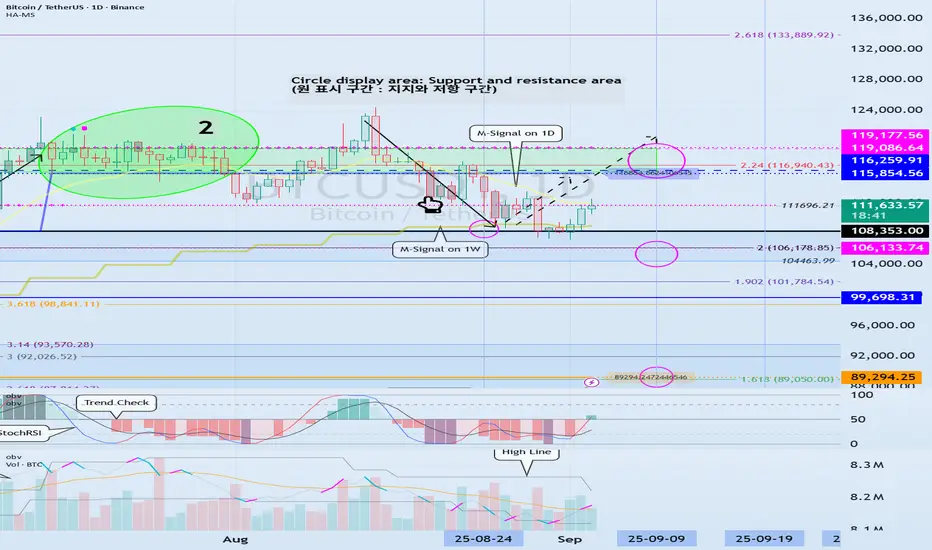
(BTCUSDT 1D chart)
The TC (Trend Check) indicator appears to have risen above the 0 level.
Accordingly, the key question is whether support can be found around 111696.21.
For the uptrend to continue, the OBV indicator must rise above the High Line and remain so.
-
The volatility period in September is expected to occur around September 9th, September 19th, and September 28th.
-
Thank you for reading.
I wish you successful trading.
--------------------------------------------------
- This is an explanation of the big picture.
(3-year bull market, 1-year bear market pattern)

I will explain in more detail when the bear market begins.
------------------------------------------------------
※ Follow X to check out the posts.
※ X를 팔로우하고 게시물을 확인하세요.
◆ t.me/readCryptoChannel
[HA-MS Indicator]
bit.ly/3YxHgvN
[OBV Indicator]
bit.ly/4dcyny3
※ X를 팔로우하고 게시물을 확인하세요.
◆ t.me/readCryptoChannel
[HA-MS Indicator]
bit.ly/3YxHgvN
[OBV Indicator]
bit.ly/4dcyny3
Related publications
Disclaimer
The information and publications are not meant to be, and do not constitute, financial, investment, trading, or other types of advice or recommendations supplied or endorsed by TradingView. Read more in the Terms of Use.