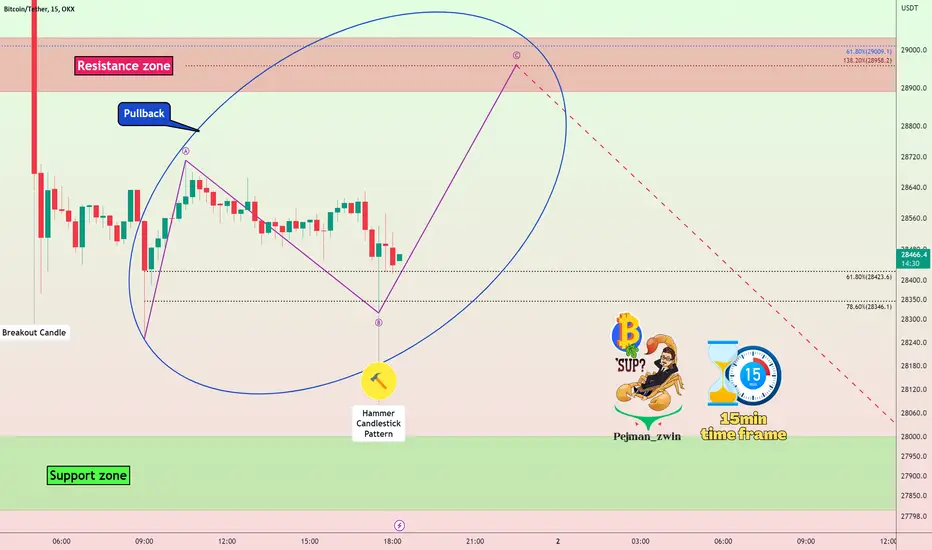
Bitcoin lost its support zone with a long-bodied red candlestick (currently acting as a🔴resistance zone($ 29,030-$ 28,880)🔴.
The corrective zigzag structure(ABC/5-3-5) is expected to play the role of a pullback to the lost support zone, and then Bitcoin will fall again to the next 🟢support zone($ 28,800-$ 27,800)🟢.
💡The sign of the end of wave B can be the Hammer Candlestick Pattern, Fibonacci levels, etc.💡
Bitcoin Analyze ( OKX:BTCUSDT ), 15-minute time frame ⏰.
Do not forget to put Stop loss for your positions (For every position you want to open).
Please follow your strategy, this is just my Idea, and I will be glad to see your ideas in this post.
Please do not forget the ✅' like'✅ button 🙏😊 & Share it with your friends; thanks, and Trade safe.
Note
If BTC goes over $ 28,580 = we can verify the end of wave B.Note
In the new update, the waves changed.
🎁Welcome than a 50% bonus(Low Spread)👉vtm.pro/Y3AV7r
🎁Get a 20% Discount on your trading FEE on BYBIT:👉partner.bybit.com/b/PEJMANZWIN
🎁Get a 20% Bonus & 30% Discount on LBANK exchange(NO KYC)👉lbank.one/join/uBythQd
🎁Get a 20% Discount on your trading FEE on BYBIT:👉partner.bybit.com/b/PEJMANZWIN
🎁Get a 20% Bonus & 30% Discount on LBANK exchange(NO KYC)👉lbank.one/join/uBythQd
Related publications
Disclaimer
The information and publications are not meant to be, and do not constitute, financial, investment, trading, or other types of advice or recommendations supplied or endorsed by TradingView. Read more in the Terms of Use.