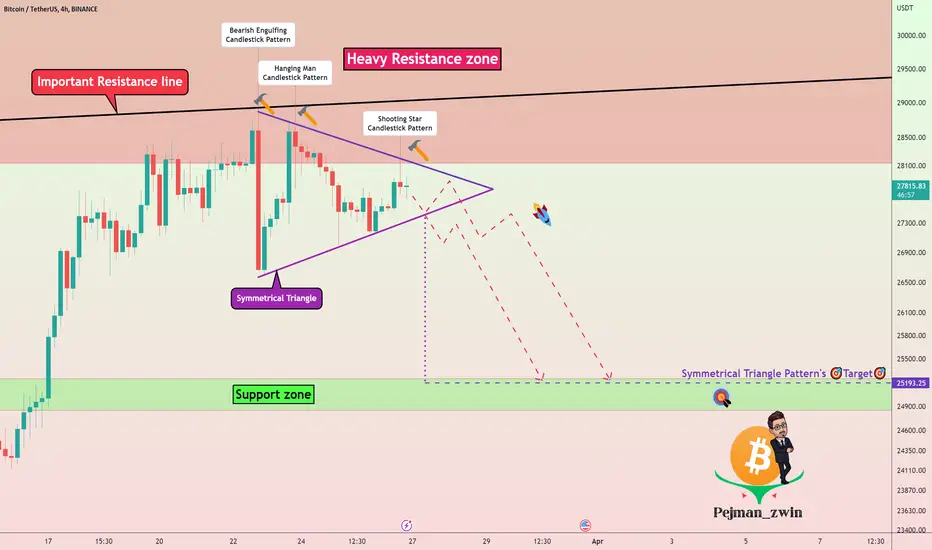
Bitcoin seems to have managed to form a symmetrical triangle near the🔴heavy resistance zone ($32,400-$28,120)🔴 and resistance line.
Also, candlestick reversal patterns on the upper line of the triangle can be a sign to break the lower line of the triangle.
I expect the lower line of the symmetrical triangle will eventually break and take Bitcoin to the 🟢support zone($25,250-$24,830)🟢.
Bitcoin Analyze ( BTCUSDT ), 4-hour time frame ⏰.
Do not forget to put Stop loss for your positions (For every position you want to open).
Please follow your strategy, this is just my Idea, and I will be glad to see your ideas in this post.
Please do not forget the ✅' like'✅ button 🙏😊 & Share it with your friends; thanks, and Trade safe.
Note
Lower line of triangle was brokenNote
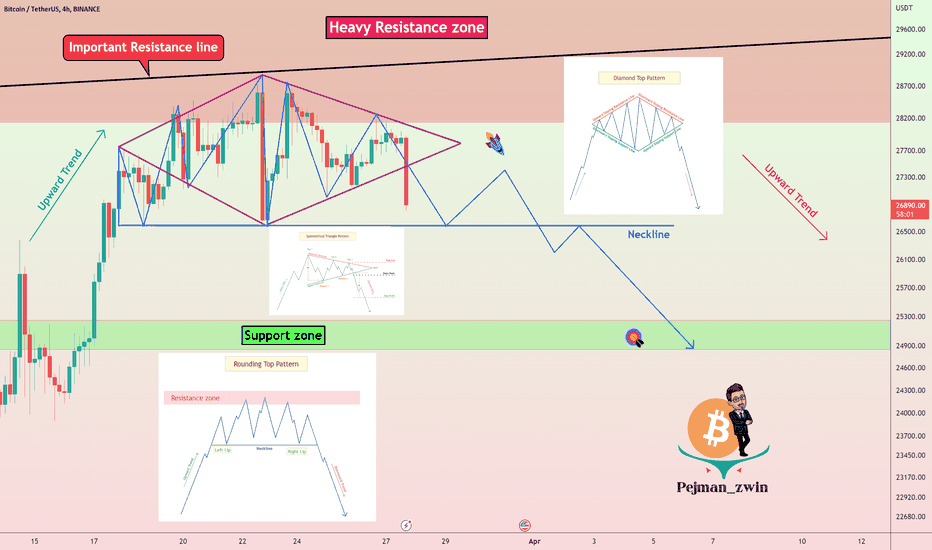
New update 👍
Note
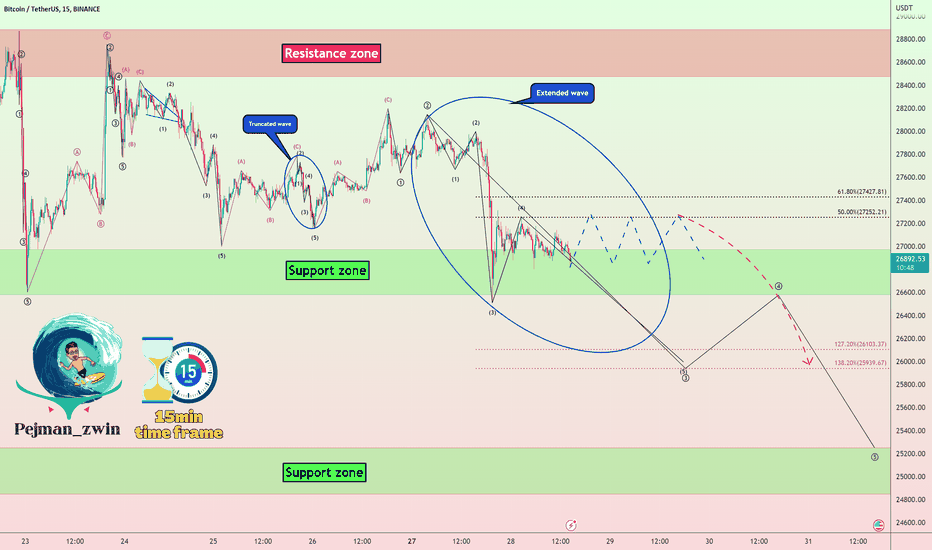
Bitcoin analysis from the point of view of Elliott waves
🎁Welcome than a 50% bonus(Low Spread)👉vtm.pro/Y3AV7r
🎁Get a 20% Discount on your trading FEE on BYBIT:👉partner.bybit.com/b/PEJMANZWIN
🎁Get a 20% Bonus & 30% Discount on LBANK exchange(NO KYC)👉lbank.one/join/uBythQd
🎁Get a 20% Discount on your trading FEE on BYBIT:👉partner.bybit.com/b/PEJMANZWIN
🎁Get a 20% Bonus & 30% Discount on LBANK exchange(NO KYC)👉lbank.one/join/uBythQd
Related publications
Disclaimer
The information and publications are not meant to be, and do not constitute, financial, investment, trading, or other types of advice or recommendations supplied or endorsed by TradingView. Read more in the Terms of Use.