1D Timeframe: The daily chart shows a bullish momentum with recent green candles indicating a strong upward push. The price is currently near the high of the recent range, suggesting potential resistance or profit-taking levels.
4H Timeframe: The 4-hour chart reveals a more detailed view of the bullish momentum. There are signs of a pullback with the latest candle forming a small body, which could indicate a temporary exhaustion in buying pressure.
1H Timeframe: On the hourly chart, the price action shows a sharp decline followed by a recovery, indicating a volatility spike. This could be a reaction to a liquidity grab below prior lows, which is a common institutional maneuver to eliminate stop-loss orders before a directional move.
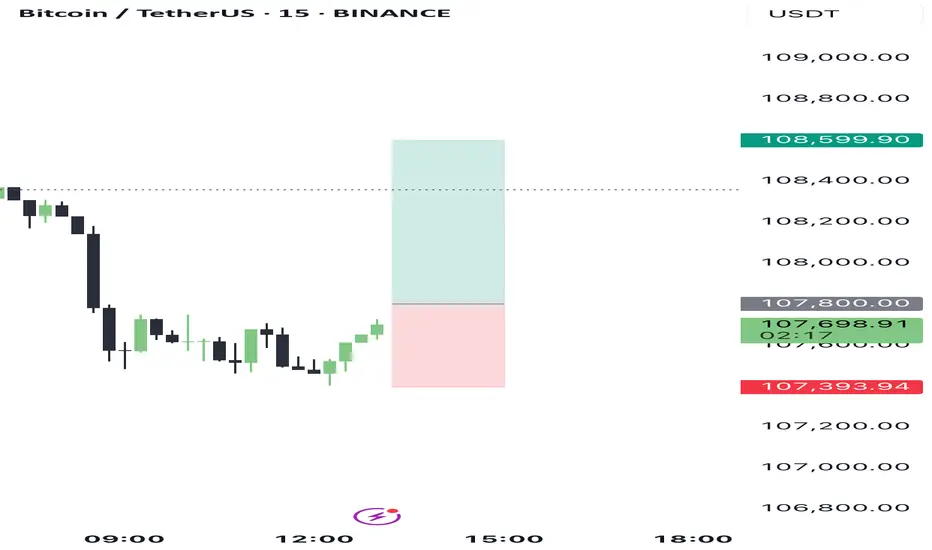
15M Timeframe: The 15-minute chart displays a recovery phase with the price moving upward steadily, suggesting that the earlier drop was likely a liquidity sweep.
5M Timeframe: This timeframe shows continued upward movement with consistent green candles, supporting the recovery narrative seen in the 15M chart.
1M Timeframe: The 1-minute chart shows a very granular view of the bullish momentum. The consistent upward ticks suggest strong buying interest at these levels, possibly from retail following the institutional cue.
INSTITUTIONAL THESIS:
Institutions appear to be in a phase of accumulation after a liquidity sweep, as evidenced by the sharp drop and subsequent recovery. The goal seems to be to push the price higher after successfully capturing liquidity below recent lows.
LEARNING POINT:
"1H Liquidity Sweep followed by a 15M and 5M bullish recovery indicating institutional buying pressure."
SIGNAL: BUY
SYMBOL: BTC/USDT ENTRY PRICE: $107,800 STOP LOSS: $107,400 TARGET PRICE: $108,600 CONDITION: Buy limit order post-1M confirmation of continued bullish momentum. RATIONALE: The setup aligns with a liquidity sweep followed by a bullish recovery across multiple timeframes, indicating strong buying interest. The entry is set above the current 1M high to ensure momentum continuation, with a stop placed just below the recent 1H low to minimize exposure to another potential liquidity sweep. STRATEGIES USED: Liquidity Sweep Recovery, Multi-Timeframe Bullish Alignment URGENCY: HIGH TIMEFRAME: Short-term CONFIDENCE SCORE: 85% RISK/REWARD RATIO: Calculated as follows:
Risk: $107,800 (Entry) - $107,400 (Stop) = $400
Reward: $108,600 (Target) - $107,800 (Entry) = $800
Ratio: 800 / 400 = 2:1
4H Timeframe: The 4-hour chart reveals a more detailed view of the bullish momentum. There are signs of a pullback with the latest candle forming a small body, which could indicate a temporary exhaustion in buying pressure.
1H Timeframe: On the hourly chart, the price action shows a sharp decline followed by a recovery, indicating a volatility spike. This could be a reaction to a liquidity grab below prior lows, which is a common institutional maneuver to eliminate stop-loss orders before a directional move.
15M Timeframe: The 15-minute chart displays a recovery phase with the price moving upward steadily, suggesting that the earlier drop was likely a liquidity sweep.
5M Timeframe: This timeframe shows continued upward movement with consistent green candles, supporting the recovery narrative seen in the 15M chart.
1M Timeframe: The 1-minute chart shows a very granular view of the bullish momentum. The consistent upward ticks suggest strong buying interest at these levels, possibly from retail following the institutional cue.
INSTITUTIONAL THESIS:
Institutions appear to be in a phase of accumulation after a liquidity sweep, as evidenced by the sharp drop and subsequent recovery. The goal seems to be to push the price higher after successfully capturing liquidity below recent lows.
LEARNING POINT:
"1H Liquidity Sweep followed by a 15M and 5M bullish recovery indicating institutional buying pressure."
SIGNAL: BUY
SYMBOL: BTC/USDT ENTRY PRICE: $107,800 STOP LOSS: $107,400 TARGET PRICE: $108,600 CONDITION: Buy limit order post-1M confirmation of continued bullish momentum. RATIONALE: The setup aligns with a liquidity sweep followed by a bullish recovery across multiple timeframes, indicating strong buying interest. The entry is set above the current 1M high to ensure momentum continuation, with a stop placed just below the recent 1H low to minimize exposure to another potential liquidity sweep. STRATEGIES USED: Liquidity Sweep Recovery, Multi-Timeframe Bullish Alignment URGENCY: HIGH TIMEFRAME: Short-term CONFIDENCE SCORE: 85% RISK/REWARD RATIO: Calculated as follows:
Risk: $107,800 (Entry) - $107,400 (Stop) = $400
Reward: $108,600 (Target) - $107,800 (Entry) = $800
Ratio: 800 / 400 = 2:1
Disclaimer
The information and publications are not meant to be, and do not constitute, financial, investment, trading, or other types of advice or recommendations supplied or endorsed by TradingView. Read more in the Terms of Use.
Disclaimer
The information and publications are not meant to be, and do not constitute, financial, investment, trading, or other types of advice or recommendations supplied or endorsed by TradingView. Read more in the Terms of Use.