Your Coin, our Analysis
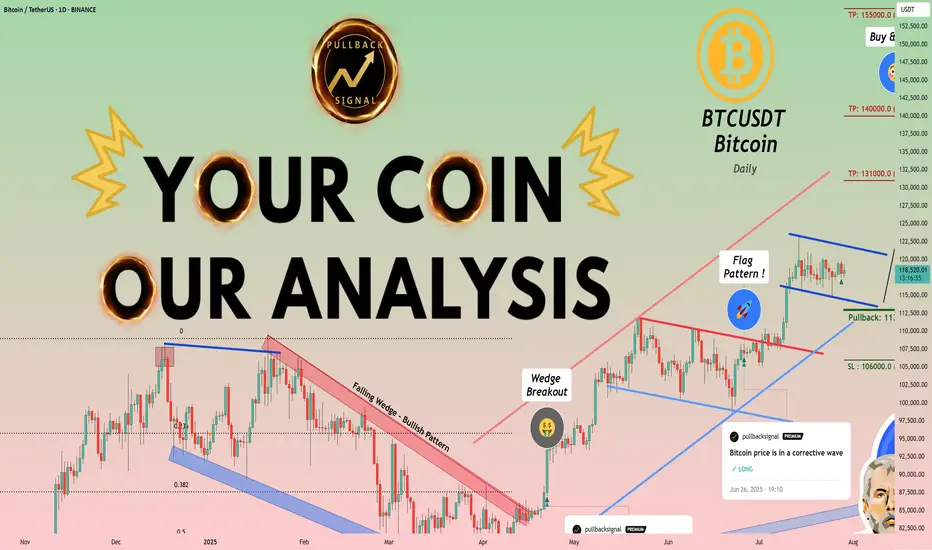
Write charts with potential for the medium term in the commentsThe daily chart of Bitcoin has entered a correction again
So we are buying Bitcoin again according to our strategy
But you write to us in the comments section what charts you would like us to analyze for you.
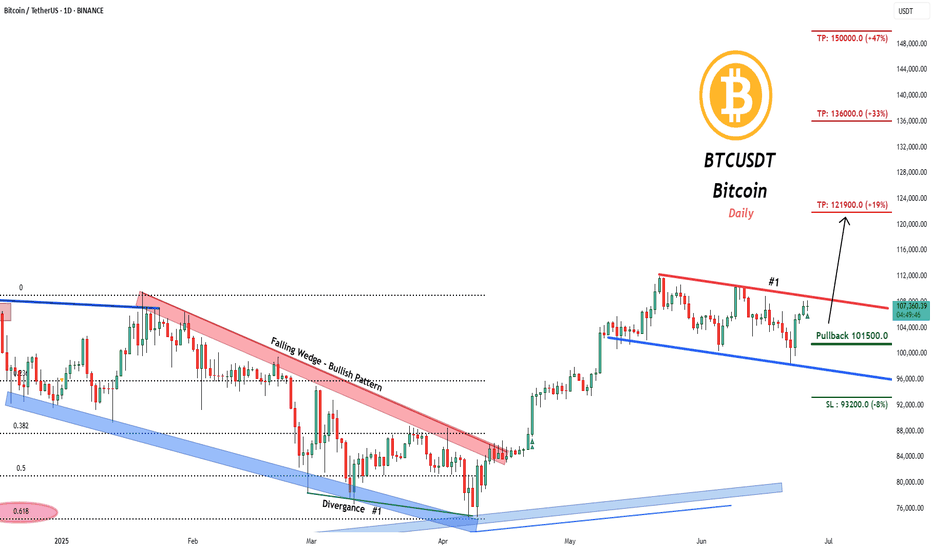
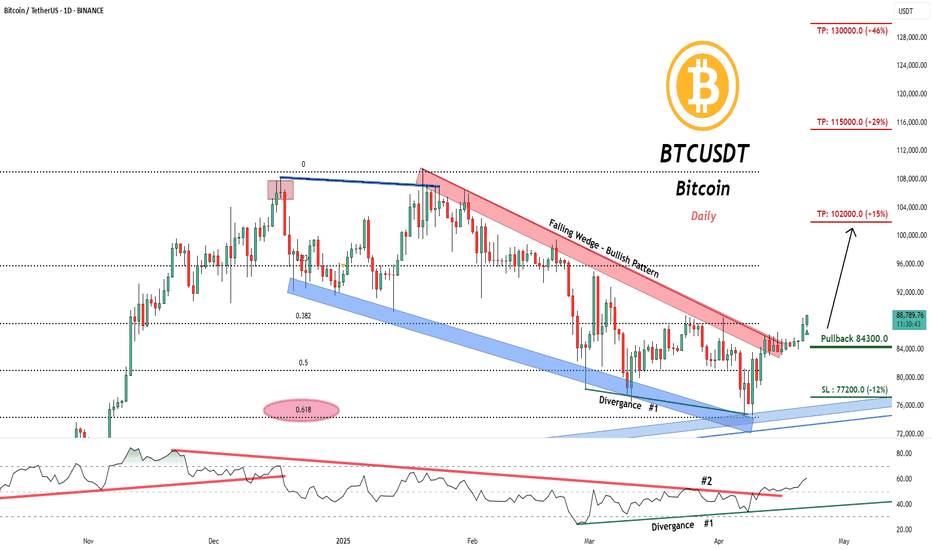
Bitcoin Trading Setup (preferably the spot market) :BTCUSDT Bitcoin (Daily)
⬆️Buy now or Buy on 113000.0
⭕️SL @ 106000.0 (-10%)
🔵TP1 @ 131000.0 (+10%)
🔵TP2 @ 140000.0 (+18%)
🔵TP3 @ 150000.0 (+30%)
What are these signals based on?Classical Technical Analysis
Price Action
Supply and Demand
Candlesticks
Fibonacci
liquidity
RSI, Moving Average , Ichimoku , Bollinger Bands
Risk Warning
Trading Forex, CFDs, Crypto, Futures, and Stocks involve a risk of loss. Please consider carefully if such trading is appropriate for you. Past performance is not indicative of future results.
With this view of the market, what projects do you propose?
✨Gold and Silver signals with high accuracy💎
🏆Spot signals for more than 100 Crypto pairs
⭐️Futures signals for more then 44 Crypto pairs
💰Forex signals for more than 28 Pairs
t.me/pullbacksignal
🏆Spot signals for more than 100 Crypto pairs
⭐️Futures signals for more then 44 Crypto pairs
💰Forex signals for more than 28 Pairs
t.me/pullbacksignal
Related publications
Disclaimer
The information and publications are not meant to be, and do not constitute, financial, investment, trading, or other types of advice or recommendations supplied or endorsed by TradingView. Read more in the Terms of Use.