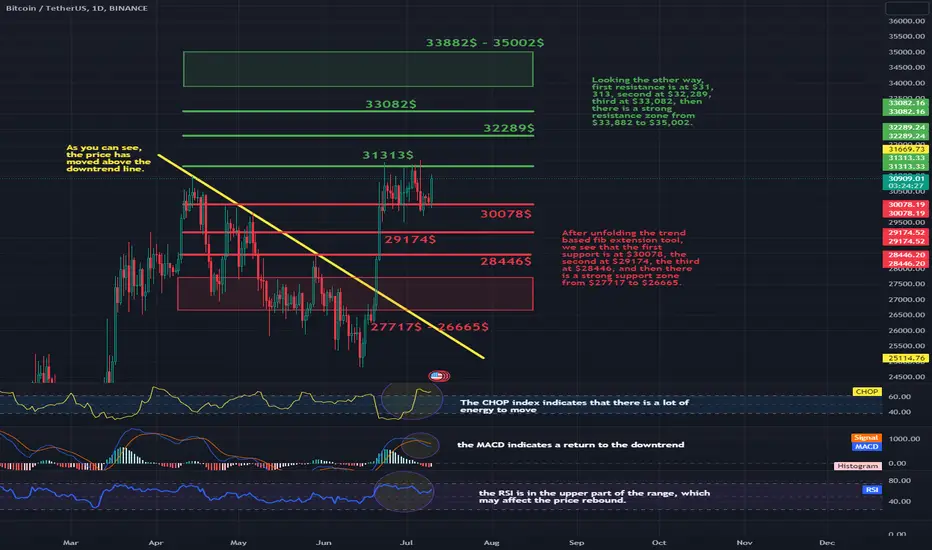
Hello everyone, let's look at the BTC to USDT chart on a single day timeframe. As you can see, the price has moved above the downtrend line.
After unfolding the trend based fib extension tool, we see that the first support is at $30078, the second at $29174, the third at $28446, and then there is a strong support zone from $27717 to $26665.
Looking the other way, first resistance is at $31,313, second at $32,289, third at $33,082, then there is a strong resistance zone from $33,882 to $35,002.
The CHOP index indicates that there is a lot of energy to move, the MACD indicates a return to the downtrend, and the RSI is in the upper part of the range, which may affect the price rebound.
Disclaimer
The information and publications are not meant to be, and do not constitute, financial, investment, trading, or other types of advice or recommendations supplied or endorsed by TradingView. Read more in the Terms of Use.
Disclaimer
The information and publications are not meant to be, and do not constitute, financial, investment, trading, or other types of advice or recommendations supplied or endorsed by TradingView. Read more in the Terms of Use.