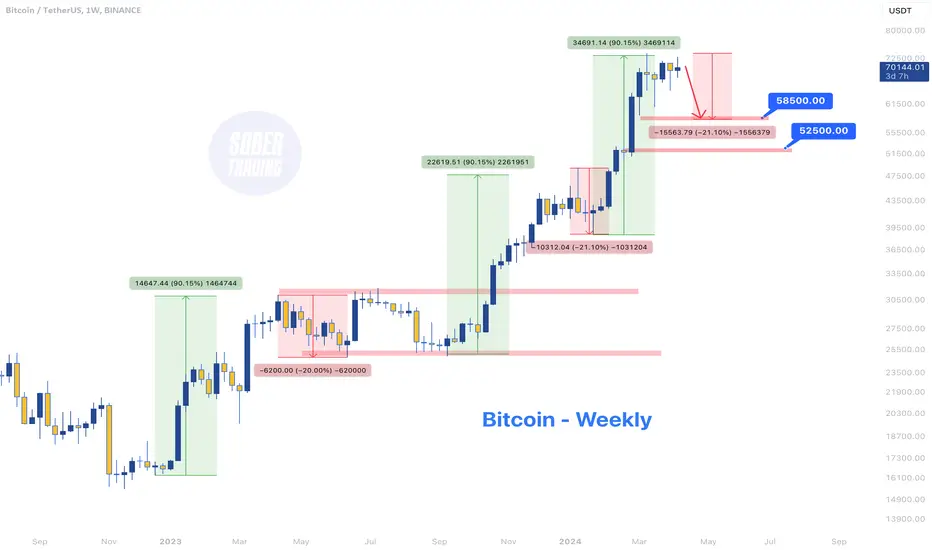
The Bitcoin weekly chart exhibits a pattern of three significant upswings, each nearing a 90% increase, followed by roughly 20% corrections after the first and second legs.
As we approach the halving event, a pullback of at least 20% seems plausible, suggesting a potential target around $58K.
Given this historical pattern and the cyclic nature of Bitcoin's price action, such a retracement would not be out of the ordinary.
As we approach the halving event, a pullback of at least 20% seems plausible, suggesting a potential target around $58K.
Given this historical pattern and the cyclic nature of Bitcoin's price action, such a retracement would not be out of the ordinary.
Note
Bitcoin's trajectory is aligning with the anticipated path, descending towards the $58K mark. This level is critical as it may act as a magnet for stop orders, potentially culminating the completion of the second leg of its recent movements.Trade closed: target reached
Could anyone else explain this pullback with such precision? I anticipated it accurately, and it happened just as I expected.🚀 Join Our Free Telegram Channels!
📈 Crypto – Bitcoin daily analysis & exclusive Altcoins opportunities!
t.me/Sober_Trading
💵 Gold & Forex – Expert insights & accurate signals!
t.me/Sober_Forex
🎯 Stay ahead with free updates!
📈 Crypto – Bitcoin daily analysis & exclusive Altcoins opportunities!
t.me/Sober_Trading
💵 Gold & Forex – Expert insights & accurate signals!
t.me/Sober_Forex
🎯 Stay ahead with free updates!
Disclaimer
The information and publications are not meant to be, and do not constitute, financial, investment, trading, or other types of advice or recommendations supplied or endorsed by TradingView. Read more in the Terms of Use.
🚀 Join Our Free Telegram Channels!
📈 Crypto – Bitcoin daily analysis & exclusive Altcoins opportunities!
t.me/Sober_Trading
💵 Gold & Forex – Expert insights & accurate signals!
t.me/Sober_Forex
🎯 Stay ahead with free updates!
📈 Crypto – Bitcoin daily analysis & exclusive Altcoins opportunities!
t.me/Sober_Trading
💵 Gold & Forex – Expert insights & accurate signals!
t.me/Sober_Forex
🎯 Stay ahead with free updates!
Disclaimer
The information and publications are not meant to be, and do not constitute, financial, investment, trading, or other types of advice or recommendations supplied or endorsed by TradingView. Read more in the Terms of Use.