Quick Hey friends 👋
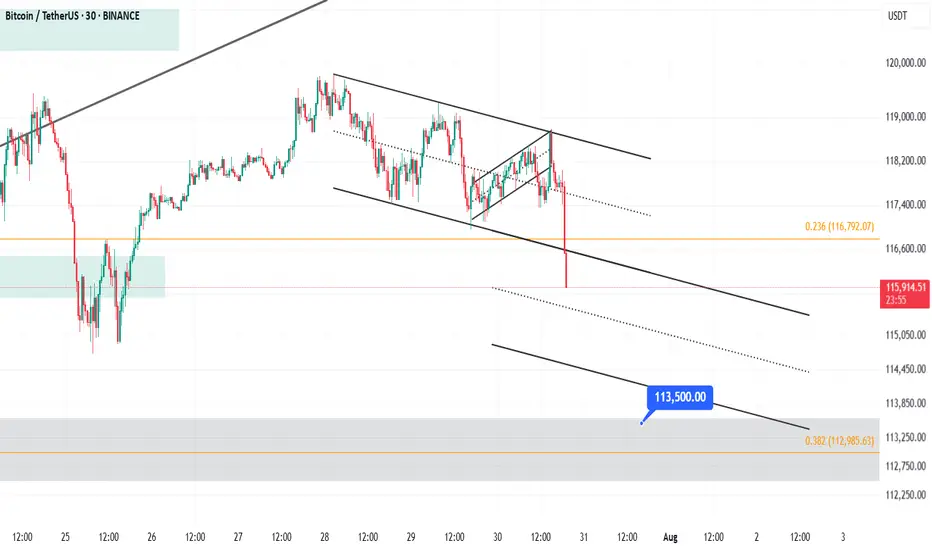
Bitcoin was recently moving inside a weak upward channel on the 30-minute chart. But now, it has broken below the channel with a strong bearish candle. This suggests we’re entering a short-term correction.
🔹 However, don’t forget — the overall trend is still bullish.
This drop looks more like a healthy pullback, not the start of a full downtrend.
🎯 Possible Targets for This Correction:
✅ Target 1: Around $114,500
(This comes from measuring the width of the broken channel.)
✅ Target 2: Strong support near $113,500
(This level has shown solid buyer interest in the past.)
📊 The RSI is also approaching the oversold zone, which means we might see a small bounce or slowdown in the drop soon.
📌 In short:
This is likely just a dip in a bigger uptrend. Be patient, watch key support zones, and don’t rush into trades.
Always stick to proper risk management! 💼
Bitcoin Analysis – 30-Minute Timeframe
Trade closed: target reached
Bitcoin has reached the $113,500 support level — if buyers hold this zone, a rebound is possible.But if it breaks down, the next target could be around $110,000.
Disclaimer
The information and publications are not meant to be, and do not constitute, financial, investment, trading, or other types of advice or recommendations supplied or endorsed by TradingView. Read more in the Terms of Use.
Disclaimer
The information and publications are not meant to be, and do not constitute, financial, investment, trading, or other types of advice or recommendations supplied or endorsed by TradingView. Read more in the Terms of Use.