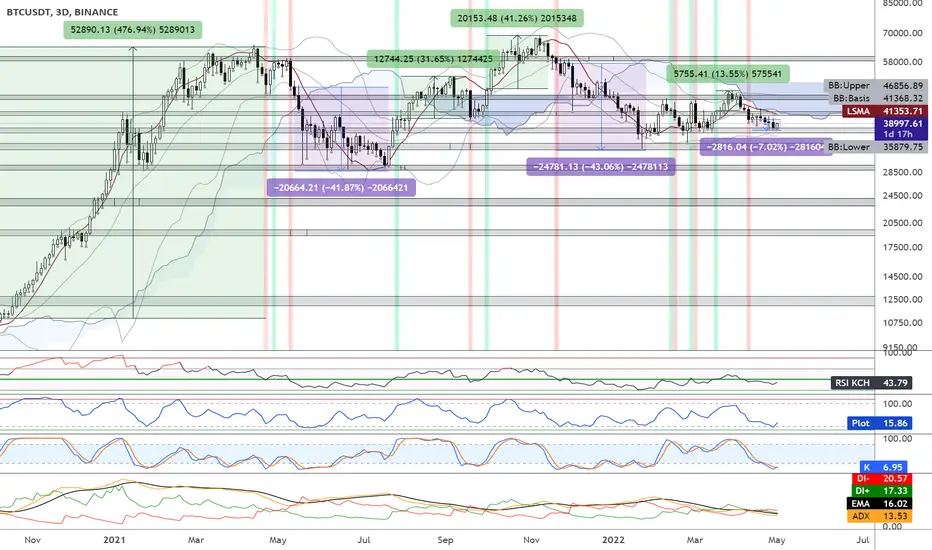
BTC has been in a sideways range for a while between roughly 37.000 and 46.500 USDT. BTC dumped 7% after the bearish Supertrend Ninja - Clean signal on the 10th April (red vertical line on the background). Currently BTC is bouncing on support. If BTC holds here it is still a higher low.
The Supertrend Ninja - Clean gave 4 bullish signal (with the biggest 477%). In 2021 it gave 3 bullish signals, with 2 big bullruns (32% and 41%). In 2022 it gave 3 bullish signal.
Let's have a look at the other indicators. The Stoch RSI is in oversold levels, pointing upwards. K is above D, which is a good sign.
BTC is still in the Bearish Zone of the Ichimoku Cloud, which is bearish .
The RSI is range bound at 44 (40-60).
If we take a look at the Average Directional Index ( ADX DI) its bearish. The +DI (Green Line) is below the -DI (Red Line). While the Trend Strength is becoming weak. Since the ADX (Orange Line) is below its 9 Period EMA (Black Line).
Currently BTC is also below its Bollinger Bands Middle, Band Basis 20 Period SMA and the Least Squares Moving Average ( LSMA ). Which are bearish signs. Going down here, the next support is at 36.500 and 34.500 USDT. Supports and Resistances are highlighted as grey blocks.
Conclusion: BTC continues moving sideways or going downwards.
Thank you for reading.
Namasté 🙏
Disclaimer: Ideas are for entertainment purposes only. Not financial advice. Your own due diligence is highly advised before entering trades. Past performance is no guarantee of future returns.
What Indicators Do I Use:
In the chart I am using the "Supertrend Ninja - Clean", which is a trend-following indicator (Green and red vertical lines on the background). When the background of the candlestick closes green (vertical line). It indicates a possible bullish (up)trend. And red for downtrends.
Beware of scammers. I do NOT have Telegram, Discord, Instagram, Twitter, Youtube or Facebook.
Tradingview is the only channel I use.
Tradingview is the only channel I use.
Disclaimer
The information and publications are not meant to be, and do not constitute, financial, investment, trading, or other types of advice or recommendations supplied or endorsed by TradingView. Read more in the Terms of Use.