🔰You can see bitcoin analysis in an hour time💰
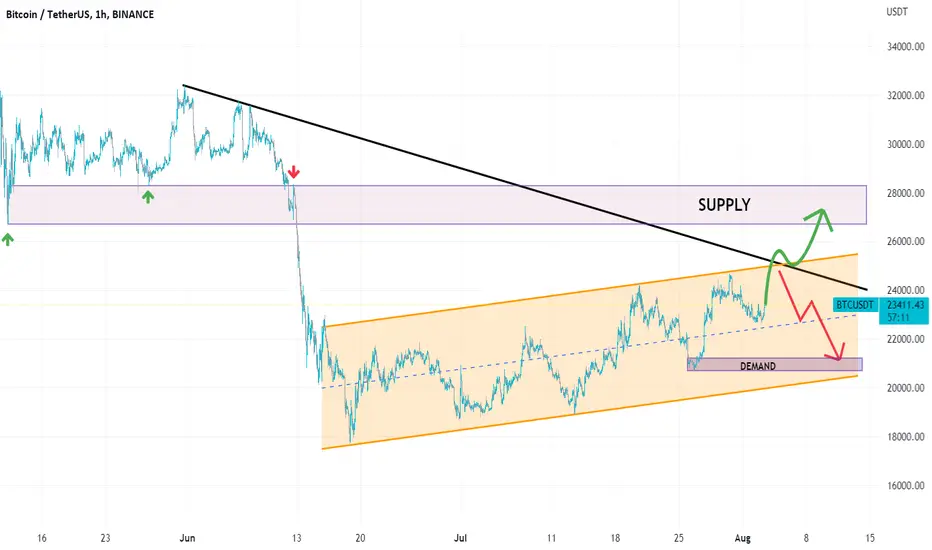
The price movement is understood according to the black downtrend line and the orange channel.‼️ As you can see in the picture, two important areas of supply and demand are specified.🧐 Bitcoin's price movement is expected to be shown in green and red.💣🔍
Do you think the RED❤️ trend makes more sense for Bitcoin or the GREEN💚trend❓❗️
I hope the analysis was useful for you🤍🌹
📌Please introduce the channel to your friends 🙏🏻
_______________📈TRADER STREET📉_______________
Related publications
Disclaimer
The information and publications are not meant to be, and do not constitute, financial, investment, trading, or other types of advice or recommendations supplied or endorsed by TradingView. Read more in the Terms of Use.
Related publications
Disclaimer
The information and publications are not meant to be, and do not constitute, financial, investment, trading, or other types of advice or recommendations supplied or endorsed by TradingView. Read more in the Terms of Use.