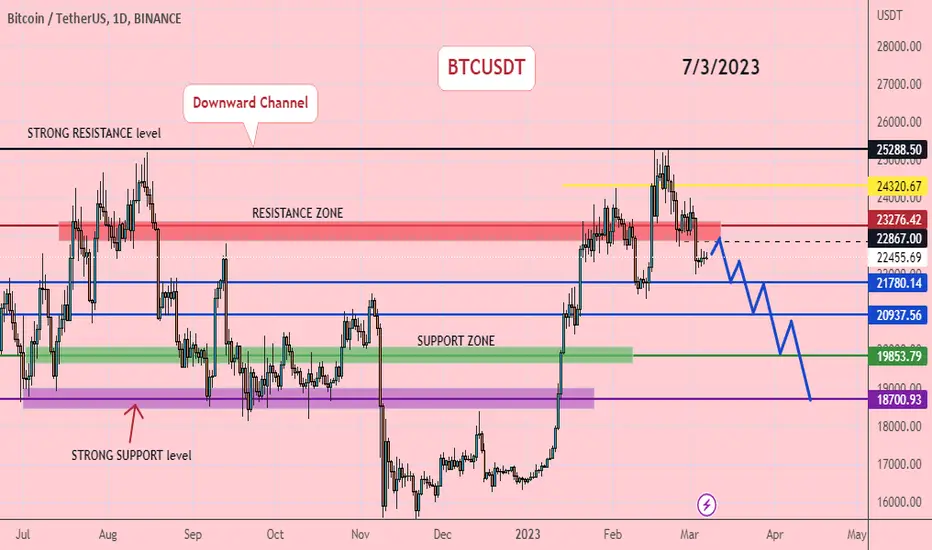
BTCUSDT daily chart, you can see that the price is below the 25288.50 level which is a key resistance zone. And it also indicates a downtrend. This week, if the price fails to break through the resistance 23276.42, expect further declines. Wait to sell the red zone, targets 21780, 20937, 19853 and 18700 >> GooD Luck 😊
✅ Sign UP: icmarkets.com/?camp=23031
✅ Copy Trade: GMI (IB code: 16156)
bit.ly/GMP16156
✅Free Signals : t.me/joinchat/_JlEdCOnVyA4ZmZl
💌 Telegram: t.me/HENGFOREX95
✅ Copy Trade: GMI (IB code: 16156)
bit.ly/GMP16156
✅Free Signals : t.me/joinchat/_JlEdCOnVyA4ZmZl
💌 Telegram: t.me/HENGFOREX95
Related publications
Disclaimer
The information and publications are not meant to be, and do not constitute, financial, investment, trading, or other types of advice or recommendations supplied or endorsed by TradingView. Read more in the Terms of Use.