Bitcoin is currently forming another higher high within an established upward structure on the weekly timeframe.
In the previous two overbought scenarios on the weekly chart, significant retracements occurred shortly after the Relative Strength Index (RSI) entered the 72–82 range. These retracements followed parabolic price moves, signaling local tops.
📊 Current RSI Update:
As of this analysis, the weekly RSI stands at 66—a level that historically preceded strong upward moves. In both prior cycles, Bitcoin continued climbing after reaching RSI 56, before eventually topping out once the RSI reached the 72–82 range.
⏳ Timing Analysis:
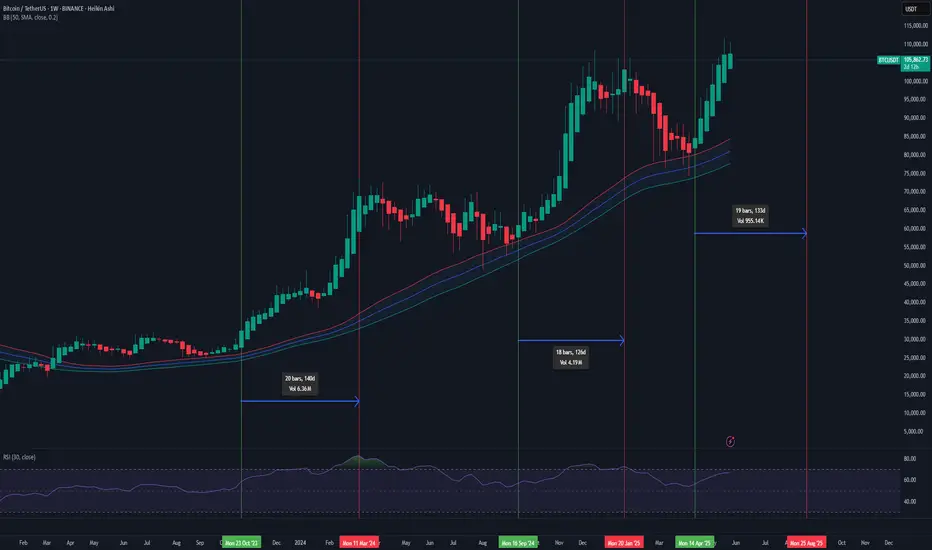
Based on the average duration from when RSI crossed above 56 to Bitcoin’s major price peaks, we estimate there could be approximately 12 weeks remaining before a potential major retracement. This estimate is derived from:
March 2024 peak: 140 days from RSI 58
January 2025 peak: 126 days from RSI 56
Projected average: 133 days (~12 weeks)
Additionally, when weekly candles bounced off the lower Bollinger Band, the price subsequently moved higher, indicating continued bullish momentum.
🔍 What to Watch For:
RSI climbing past 70 could signal the final leg of the current rally.
RSI entering the 72–82 range has historically aligned with local tops.
Watch for volume divergence, candle exhaustion patterns, or other signs of weakening momentum near this RSI zone.
⚠️ Disclaimer:
This analysis is not a prediction or financial advice. It is a pattern-based observation derived from historical data. Market conditions can change rapidly. Always conduct your own research and manage your risk accordingly.
In the previous two overbought scenarios on the weekly chart, significant retracements occurred shortly after the Relative Strength Index (RSI) entered the 72–82 range. These retracements followed parabolic price moves, signaling local tops.
📊 Current RSI Update:
As of this analysis, the weekly RSI stands at 66—a level that historically preceded strong upward moves. In both prior cycles, Bitcoin continued climbing after reaching RSI 56, before eventually topping out once the RSI reached the 72–82 range.
⏳ Timing Analysis:
Based on the average duration from when RSI crossed above 56 to Bitcoin’s major price peaks, we estimate there could be approximately 12 weeks remaining before a potential major retracement. This estimate is derived from:
March 2024 peak: 140 days from RSI 58
January 2025 peak: 126 days from RSI 56
Projected average: 133 days (~12 weeks)
Additionally, when weekly candles bounced off the lower Bollinger Band, the price subsequently moved higher, indicating continued bullish momentum.
🔍 What to Watch For:
RSI climbing past 70 could signal the final leg of the current rally.
RSI entering the 72–82 range has historically aligned with local tops.
Watch for volume divergence, candle exhaustion patterns, or other signs of weakening momentum near this RSI zone.
⚠️ Disclaimer:
This analysis is not a prediction or financial advice. It is a pattern-based observation derived from historical data. Market conditions can change rapidly. Always conduct your own research and manage your risk accordingly.
Disclaimer
The information and publications are not meant to be, and do not constitute, financial, investment, trading, or other types of advice or recommendations supplied or endorsed by TradingView. Read more in the Terms of Use.
Disclaimer
The information and publications are not meant to be, and do not constitute, financial, investment, trading, or other types of advice or recommendations supplied or endorsed by TradingView. Read more in the Terms of Use.