📉 Bitcoin (BTC/USDT) Technical Analysis | Key Resistance Test – What's Next?
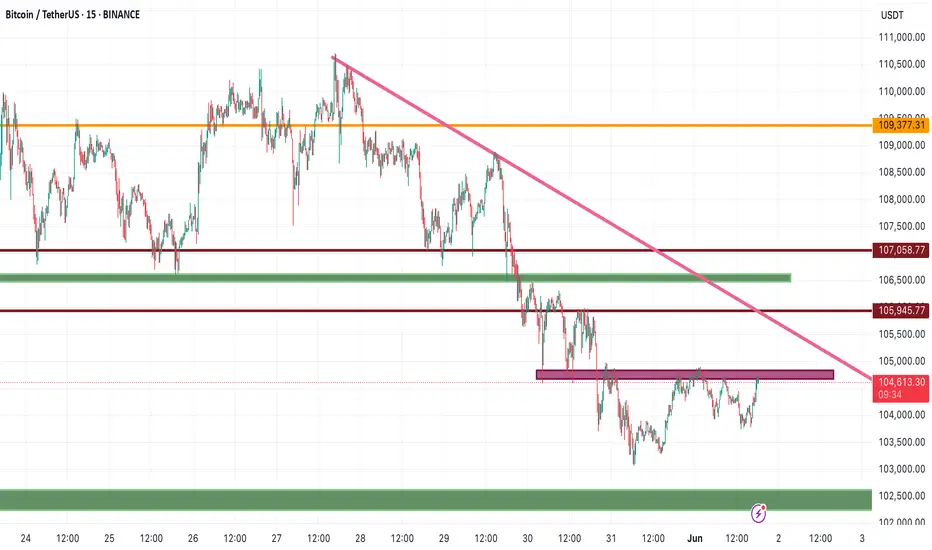
As shown in the 15-minute chart, Bitcoin is currently testing a short-term resistance zone that has previously acted as a strong rejection area. The market is now approaching a decision point that could define the next short-term move.
🟢 Bullish Scenario: Breakout and Momentum Continuation
If BTC successfully breaks above the current resistance with a strong bullish candle, we could see a continuation of the upward move. In this case, the next key targets are:
🔺 Descending trendline (pink) – a significant dynamic resistance level
🔺 $105,940 – a key resistance zone with previous price reactions
A breakout above these levels could trigger a fresh wave of buying pressure.
🔻 Bearish Scenario: Rejection and Pullback
However, if BTC gets rejected from this resistance once again, bearish momentum may resume. Key support levels to watch on the downside include:
🔻 $103,585 – short-term support with historical significance
🔻 $102,605 – stronger support and recent local bottom
Failure to hold these levels could lead to a deeper retracement or consolidation.
📌 Summary
Bitcoin is at a critical inflection point. A breakout could trigger a bullish continuation, while a rejection may lead to a short-term correction. Keep an eye on candle confirmations and volume before making any moves.
📍If you find this analysis helpful, make sure to follow me for more real-time updates and trade setups. Let's grow together as traders. 🔔
Disclaimer
The information and publications are not meant to be, and do not constitute, financial, investment, trading, or other types of advice or recommendations supplied or endorsed by TradingView. Read more in the Terms of Use.
Disclaimer
The information and publications are not meant to be, and do not constitute, financial, investment, trading, or other types of advice or recommendations supplied or endorsed by TradingView. Read more in the Terms of Use.