Hello Guy's Welcome To Another Day Of TRADING
Here we are mapping chart of BTCUSDT ( BITCOIN ) in 30-M TF
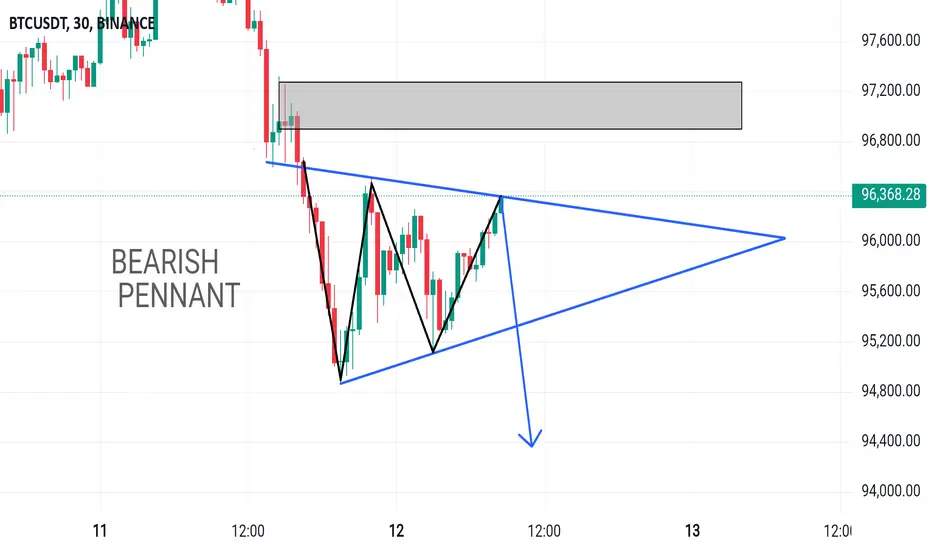
This chart shows Bitcoin’s price movement over time.
The Pattern: The price is moving inside a triangle shape, getting squeezed between two lines.
Resistance Zone: Bitcoin tried to go above $97,000 but got pushed down
RESISTANCE LEVEL. 96800/97000
TARGET WILL BE. 94000
If the price breaks below the lower line of the triangle, it may fall further, possibly to $94,000 or lower..
Here we are mapping chart of BTCUSDT ( BITCOIN ) in 30-M TF
This chart shows Bitcoin’s price movement over time.
The Pattern: The price is moving inside a triangle shape, getting squeezed between two lines.
Resistance Zone: Bitcoin tried to go above $97,000 but got pushed down
RESISTANCE LEVEL. 96800/97000
TARGET WILL BE. 94000
If the price breaks below the lower line of the triangle, it may fall further, possibly to $94,000 or lower..
Trade closed: target reached
BTCUSDT (BITCOIN) MY TARGET REACHED ALREADY DON'T FORGET TO LIKE , COMMENTS AND FOLLOW ME
Disclaimer
The information and publications are not meant to be, and do not constitute, financial, investment, trading, or other types of advice or recommendations supplied or endorsed by TradingView. Read more in the Terms of Use.
Disclaimer
The information and publications are not meant to be, and do not constitute, financial, investment, trading, or other types of advice or recommendations supplied or endorsed by TradingView. Read more in the Terms of Use.