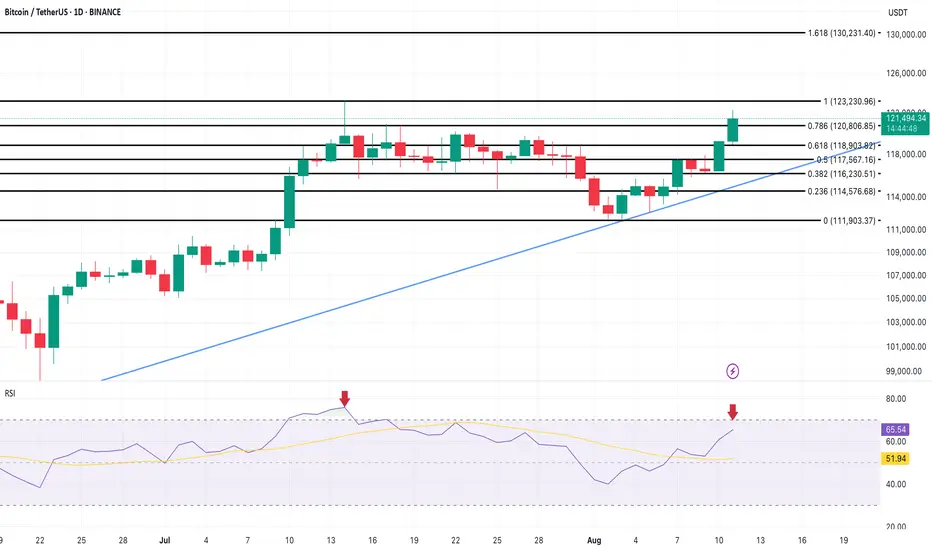
Key supports to watch are $120,806 (Fib 0.786) and $118,903 (Fib 0.618). Holding above these levels keeps the
The RSI sits near 66, well below July’s overbought 75+, suggesting there’s still room for upside before technical exhaustion kicks in. Supporting metrics like SOPR at 1.00 (versus overheated 1.03–1.05 in July) and Taker Buy/Sell Ratio at 1.14 confirm that profit-taking is limited and spot buying remains strong.
Overall, if $123,200 gives way, Bitcoin could see a faster, stronger push to new all-time highs than its last attempt. And for
Truly Unbiased Cryptocurrency News beincrypto.com
Disclaimer
The information and publications are not meant to be, and do not constitute, financial, investment, trading, or other types of advice or recommendations supplied or endorsed by TradingView. Read more in the Terms of Use.
Truly Unbiased Cryptocurrency News beincrypto.com
Disclaimer
The information and publications are not meant to be, and do not constitute, financial, investment, trading, or other types of advice or recommendations supplied or endorsed by TradingView. Read more in the Terms of Use.