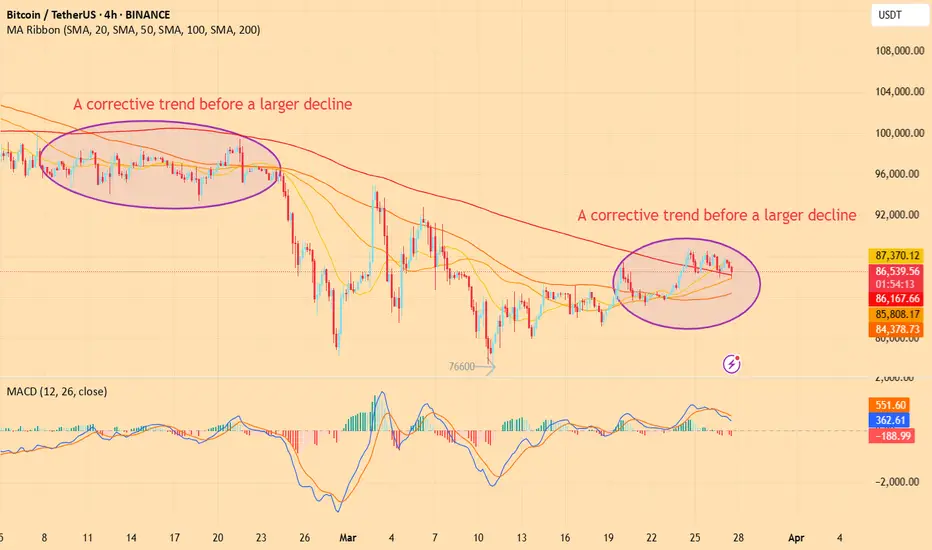
Technical analysis of BTC on March 27: Today, the large-cycle daily level closed with a small negative line yesterday, the K-line pattern was a single negative with continuous positive, the attached indicator golden cross was running with shrinking volume, and the fast and slow lines were below the zero axis. The general trend was still bearish. The four-hour chart was under pressure near the 88,800 area after the rebound last week. The current K-line pattern was a continuous negative, and the attached indicator was dead cross running. There was an obvious retracement and decline trend. Let's take a look at the continuation and strength first; the short-cycle hourly chart yesterday's European session fell and the US session continued to break the previous day's low position, and the high position was corrected in the early morning near the 87,500 area. In this way, if we continue to see a retracement and fall and break the low today, then the rebound cannot break the pressure point position, otherwise it will be difficult to fall.
Today's BTC short-term contract trading strategy: sell at the rebound 87,000 area, stop loss at the 87,500 area, and target the 85,600 area;
Today's BTC short-term contract trading strategy: sell at the rebound 87,000 area, stop loss at the 87,500 area, and target the 85,600 area;
Disclaimer
The information and publications are not meant to be, and do not constitute, financial, investment, trading, or other types of advice or recommendations supplied or endorsed by TradingView. Read more in the Terms of Use.
Disclaimer
The information and publications are not meant to be, and do not constitute, financial, investment, trading, or other types of advice or recommendations supplied or endorsed by TradingView. Read more in the Terms of Use.