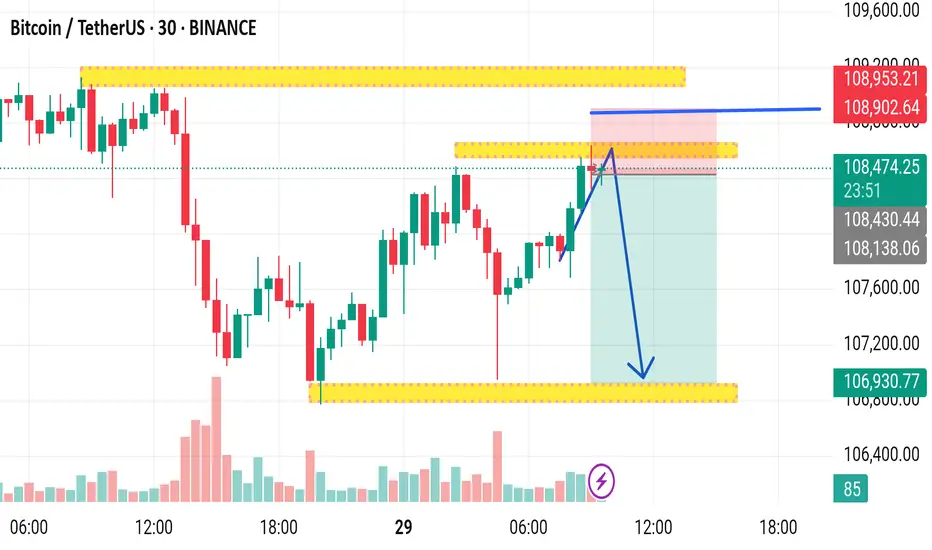
This chart is a 30-minute candlestick chart for Bitcoin/USDT (BTC/USDT) on Binance, published by Mr_Zakrii. Here's a detailed breakdown:
---
Chart Details and Analysis
1. Asset & Timeframe:
Asset: Bitcoin (BTC) / Tether (USDT)
Exchange: Binance
Timeframe: 30-minute candles
2. Current Price:
Price at snapshot: ~108,420.51 USDT
The price is shown moving upwards toward a resistance area.
3. Key Zones:
Resistance Zone (Top Yellow Box): ~108,900 – 108,950 USDT
Minor Resistance Zone (Middle Yellow Box): ~108,400 – 108,500 USDT
Support Zone (Bottom Yellow Box): ~106,900 – 107,000 USDT
4. Trading Setup (Illustrated by Blue Arrows):
A short (sell) position is being suggested:
Entry: Around 108,420.51 USDT
Stop-loss: ~108,902.64 – 108,953.21 USDT
Take-profit: ~106,930.77 USDT
The setup aims to capitalize on a reversal from the resistance zone, expecting the price to reject and drop toward the previous support.
5. Risk-Reward Visualization:
Red Box: Represents the stop-loss zone (risk)
Green Box: Represents the take-profit zone (reward)
This indicates a favorable risk-to-reward ratio, assuming price respects resistance.
6. Market Sentiment:
The price has recently surged with strong green candles and volume.
The chart suggests potential exhaustion or resistance at current levels.
7. Additional Indicators:
News/Economic Event Marker (Purple Icon): Indicates a possible upcoming event which could add volatility.
Volume: Noticeable increase in buying volume during the upward move, which may suggest momentum, but also a potential blow-off if rejected.
---
Conclusion:
The chart anticipates a short-term bearish reversal from the 108,400–108,900 resistance area down to the 106,900 support zone. The trade setup is based on price action and zone rejection. It's a technical sell setup, likely based on supply zones and momentum exhaustion.
Would you like help evaluating the risk/reward further, or how this setup aligns with broader Bitcoin market trends or news?
---
Chart Details and Analysis
1. Asset & Timeframe:
Asset: Bitcoin (BTC) / Tether (USDT)
Exchange: Binance
Timeframe: 30-minute candles
2. Current Price:
Price at snapshot: ~108,420.51 USDT
The price is shown moving upwards toward a resistance area.
3. Key Zones:
Resistance Zone (Top Yellow Box): ~108,900 – 108,950 USDT
Minor Resistance Zone (Middle Yellow Box): ~108,400 – 108,500 USDT
Support Zone (Bottom Yellow Box): ~106,900 – 107,000 USDT
4. Trading Setup (Illustrated by Blue Arrows):
A short (sell) position is being suggested:
Entry: Around 108,420.51 USDT
Stop-loss: ~108,902.64 – 108,953.21 USDT
Take-profit: ~106,930.77 USDT
The setup aims to capitalize on a reversal from the resistance zone, expecting the price to reject and drop toward the previous support.
5. Risk-Reward Visualization:
Red Box: Represents the stop-loss zone (risk)
Green Box: Represents the take-profit zone (reward)
This indicates a favorable risk-to-reward ratio, assuming price respects resistance.
6. Market Sentiment:
The price has recently surged with strong green candles and volume.
The chart suggests potential exhaustion or resistance at current levels.
7. Additional Indicators:
News/Economic Event Marker (Purple Icon): Indicates a possible upcoming event which could add volatility.
Volume: Noticeable increase in buying volume during the upward move, which may suggest momentum, but also a potential blow-off if rejected.
---
Conclusion:
The chart anticipates a short-term bearish reversal from the 108,400–108,900 resistance area down to the 106,900 support zone. The trade setup is based on price action and zone rejection. It's a technical sell setup, likely based on supply zones and momentum exhaustion.
Would you like help evaluating the risk/reward further, or how this setup aligns with broader Bitcoin market trends or news?
Disclaimer
The information and publications are not meant to be, and do not constitute, financial, investment, trading, or other types of advice or recommendations supplied or endorsed by TradingView. Read more in the Terms of Use.
Disclaimer
The information and publications are not meant to be, and do not constitute, financial, investment, trading, or other types of advice or recommendations supplied or endorsed by TradingView. Read more in the Terms of Use.