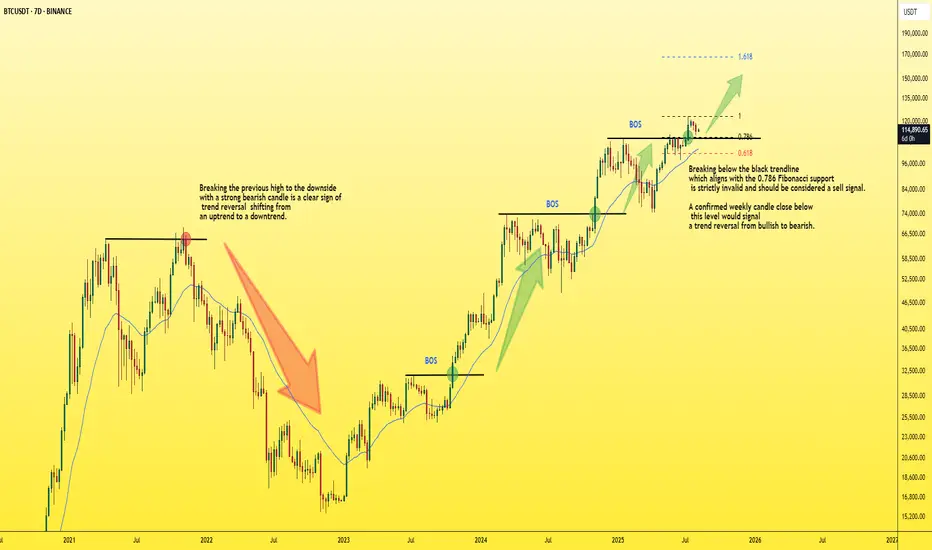
📊 This is a weekly Bitcoin chart with a key insight you should pay close attention to:
In a bullish trend, you’ll always notice higher highs being formed. Once price breaks the previous high, it's typically a strong confirmation of bullish continuation, as shown by the BOS (Break of Structure) levels marked in blue on the chart.
🔻 The BOS level must not be broken to the downside — if that happens, it signals a trend reversal from bullish to bearish, just like what occurred at the red zone I highlighted.
✅ Currently, Bitcoin has broken its previous high to the upside, which indicates the bullish trend is continuing.
🎯 Next target: $150K.
⚠️ However, if BTC pulls back for a retest and fails to bounce quickly, it will be considered a strong sell signal. That would likely lead to a correction back down toward the $80K zone.
Best regards:
Ceciliones🎯
🔻 free telegram channel🔻
t.me/itradeoncrypto
we have VIP Channel and it provides unique, premium content you won’t get anywhere else all for an affordable subscription cost.🔥
contact me for details and proofs🎯
t.me/Cecilion1
t.me/itradeoncrypto
we have VIP Channel and it provides unique, premium content you won’t get anywhere else all for an affordable subscription cost.🔥
contact me for details and proofs🎯
t.me/Cecilion1
Disclaimer
The information and publications are not meant to be, and do not constitute, financial, investment, trading, or other types of advice or recommendations supplied or endorsed by TradingView. Read more in the Terms of Use.