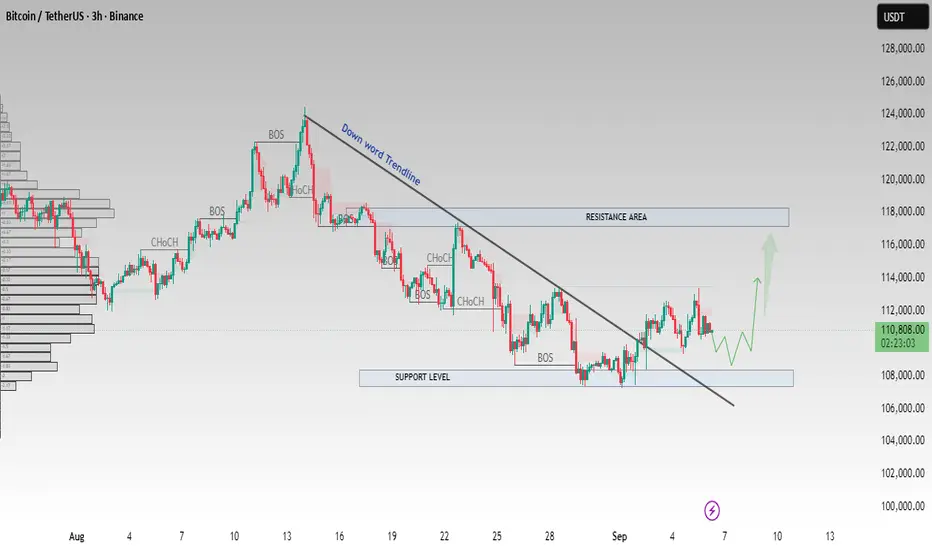
Bitcoin (BTCUSDT) on the 3H timeframe has recently broken out of a downward trendline, signaling potential bullish momentum.
✅ Support Level: $108,000 – $109,000
✅ Resistance Area: $116,000 – $118,000
✅ Key Observations: Multiple CHoCH (Change of Character) and BOS (Break of Structure) indicate a shift in market sentiment.
Price action suggests that if BTC can sustain above the support zone, we may see continuation toward the resistance area. A short-term consolidation or retest is also possible before any major push higher.
Holding above support keeps the bias bullish.
Rejection at resistance may trigger pullback opportunities.
This chart is for educational and technical analysis purposes only. Not financial advice. Always manage risk and use your own judgment before trading
Trade active
Trade has been active ; risk mange has properlyTrade closed: target reached
Trade has been succesfully$ FOREX / GOLD / BTC | Real Trades,Real Result | Risk-managed strategiesn &VIP Signal {My Personal Entries} Join Telegram _ Trade smater ||
📬 Join Free Channel:
t.me/profitmagnetpro12
📬 Join Free Channel:
t.me/profitmagnetpro12
Disclaimer
The information and publications are not meant to be, and do not constitute, financial, investment, trading, or other types of advice or recommendations supplied or endorsed by TradingView. Read more in the Terms of Use.
$ FOREX / GOLD / BTC | Real Trades,Real Result | Risk-managed strategiesn &VIP Signal {My Personal Entries} Join Telegram _ Trade smater ||
📬 Join Free Channel:
t.me/profitmagnetpro12
📬 Join Free Channel:
t.me/profitmagnetpro12
Disclaimer
The information and publications are not meant to be, and do not constitute, financial, investment, trading, or other types of advice or recommendations supplied or endorsed by TradingView. Read more in the Terms of Use.