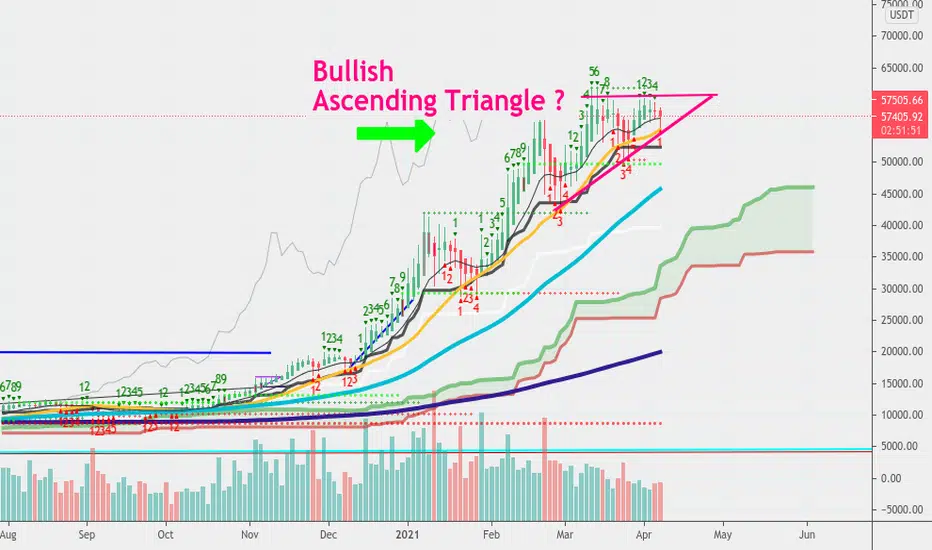
Here we see our Bitcoin 2 day chart from Binance . There does appear to be an ascending triangle forming here , inside those pink lines . This is generally a bullish indication in an uptrend . I would expect Bitcoin to break upwards from this structure - probably by the end of April .Though Bitcoin sometimes surprises us and does the opposite ! But we have seen consolidation happening on Bitcoin's chart near these 50k and 60k levels for weeks now . It should continue up ,in my opinion . I've said before I expect this to hit 72k at some point as that was a 3.618 fib from a previous chart which I will try and link below . That said we could also hit 65k and 68k first but I still expect 72k to happen at some point . End of year could obviously be much higher.
😃 Join shimmeringpath's friendly free
Telegram chat here : bulls and bears both welcome !
t.me/CryptoRisingTradersChat
Telegram chat here : bulls and bears both welcome !
t.me/CryptoRisingTradersChat
Related publications
Disclaimer
The information and publications are not meant to be, and do not constitute, financial, investment, trading, or other types of advice or recommendations supplied or endorsed by TradingView. Read more in the Terms of Use.