
a lot of people think the bottom has been put in,
and while this is entirely possible,
i bring to you a few cases which disagree with this idea.
----
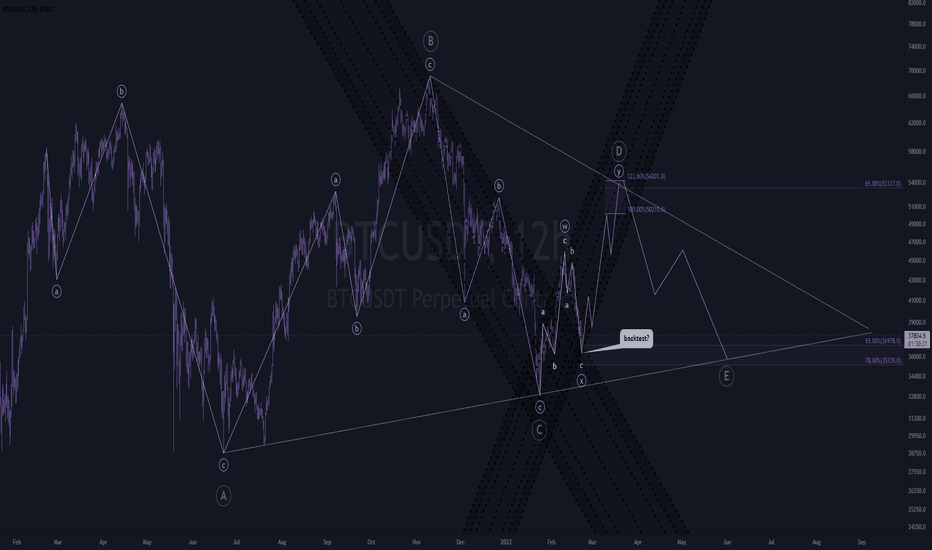
scenario #1 is "The bull trap"
is the one i've got displayed on my chart
it implies that the summer move was a 5 wave impulse which completed a larger wave 3,
and now we are in the middle of a massive wave 4 correction via a W-X-Y (3-3-5 or 3-3-3) which completes near the end of july \ beginning of august closer to 22k.
----
scenario #2 is "The wicked triangle"
i talked about it last week via 👇
this idea implies that we are also in the midst of a larger wave 4 correction, but in a slightly more deviant way.
a triangle creates uncertainty to both bulls and bears, and shakes them both out before a massive move to the upside takes place.
picture a bull flag, but on a grand scale; that's precisely what this would be ;).
----
scenario #3 - the least likely as of right now
talked about this in some of my recent videos, but it's lost it's level of probability, so you can probably just ignore this one.
though, if you are interested in another potential scenario; this one implies that we are playing out wave b (of an abc to the downside) of wave y of Wave Y of a higher degree to complete the same larger wave 4 correction as the wicked triangle scenario.

----
the idea i've got displayed on my chart is the one i favor the most of these 3 as of this moment, but my bias is very liquid, and can change if the chart tells me a different story along the way.
✌
and while this is entirely possible,
i bring to you a few cases which disagree with this idea.
----
scenario #1 is "The bull trap"
is the one i've got displayed on my chart
it implies that the summer move was a 5 wave impulse which completed a larger wave 3,
and now we are in the middle of a massive wave 4 correction via a W-X-Y (3-3-5 or 3-3-3) which completes near the end of july \ beginning of august closer to 22k.
----
scenario #2 is "The wicked triangle"
i talked about it last week via 👇
this idea implies that we are also in the midst of a larger wave 4 correction, but in a slightly more deviant way.
a triangle creates uncertainty to both bulls and bears, and shakes them both out before a massive move to the upside takes place.
picture a bull flag, but on a grand scale; that's precisely what this would be ;).
----
scenario #3 - the least likely as of right now
talked about this in some of my recent videos, but it's lost it's level of probability, so you can probably just ignore this one.
though, if you are interested in another potential scenario; this one implies that we are playing out wave b (of an abc to the downside) of wave y of Wave Y of a higher degree to complete the same larger wave 4 correction as the wicked triangle scenario.
----
the idea i've got displayed on my chart is the one i favor the most of these 3 as of this moment, but my bias is very liquid, and can change if the chart tells me a different story along the way.
✌
i only share a tiny fragment of my ideas on this platform. to view my daily work, join the lunar syndicate 9 👇
Disclaimer
The information and publications are not meant to be, and do not constitute, financial, investment, trading, or other types of advice or recommendations supplied or endorsed by TradingView. Read more in the Terms of Use.