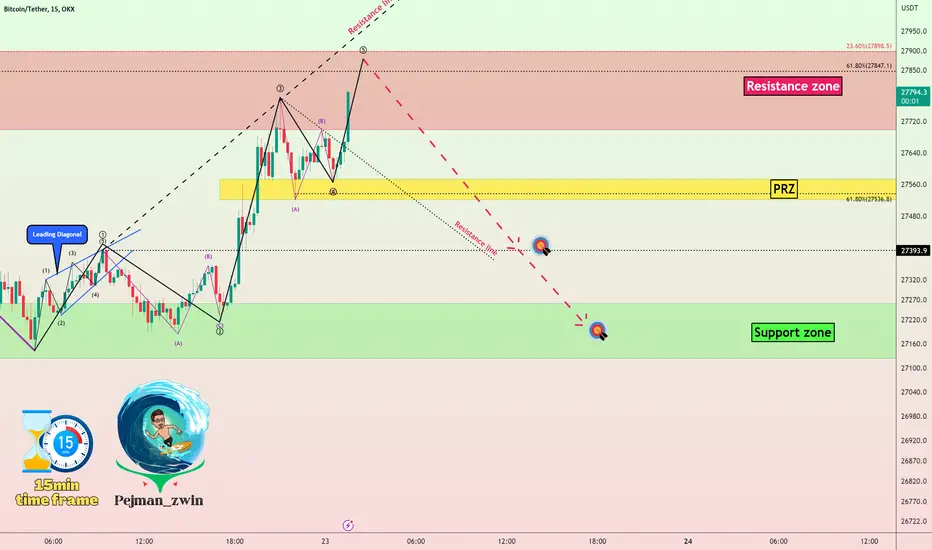
According to Elliott's wave theory, The end of wave 4 ended in the 🟡Price Reversal Zone(PRZ)🟡, and one of the signs of the end of the wave was the breaking of the resistance line upwards, and wave 5 can continue until the end of the 🔴resistance zone($ 27,900-$ 27,700)🔴.
After the confirmation of the end of wave 5, Bitcoin is expected to fall to the 🎯target🎯 I have specified in the chart or the 🟢support zone($ 27,260-$ 27,120)🟢.
In addition, We can also see the Regular Divergence(RD-) between the end of wave 3 and wave 5 in the RSI indicator and the probability that one of the valid RSI ⬇️SELL⬇️ signals, namely Bearish Failure Swing, will be seen in the next hour is very high.👇

Bitcoin Analyze ( OKX:BTCUSDT ), 15-minute time frame ⏰.
Do not forget to put Stop loss for your positions (For every position you want to open).
Please follow your strategy, this is just my Idea, and I will be glad to see your ideas in this post.
Please do not forget the ✅' like'✅ button 🙏😊 & Share it with your friends; thanks, and Trade safe.
After the confirmation of the end of wave 5, Bitcoin is expected to fall to the 🎯target🎯 I have specified in the chart or the 🟢support zone($ 27,260-$ 27,120)🟢.
In addition, We can also see the Regular Divergence(RD-) between the end of wave 3 and wave 5 in the RSI indicator and the probability that one of the valid RSI ⬇️SELL⬇️ signals, namely Bearish Failure Swing, will be seen in the next hour is very high.👇
Bitcoin Analyze ( OKX:BTCUSDT ), 15-minute time frame ⏰.
Do not forget to put Stop loss for your positions (For every position you want to open).
Please follow your strategy, this is just my Idea, and I will be glad to see your ideas in this post.
Please do not forget the ✅' like'✅ button 🙏😊 & Share it with your friends; thanks, and Trade safe.
Trade active
Note
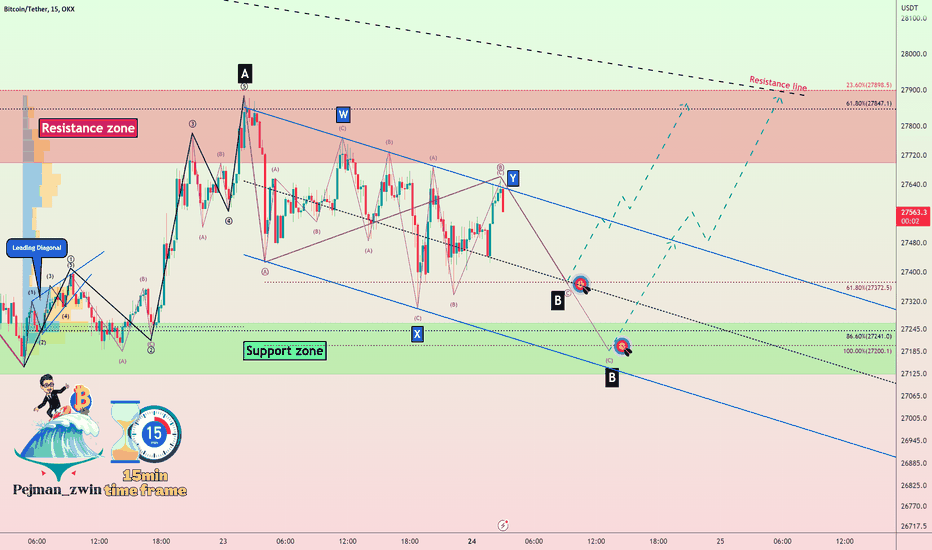
The Bearish Failure Swing signal was done according to the analysis.😊
Note
Bitcoin formed a symmetric triangle in 5 minutes, which is considered a continuation pattern (mostly).
Trade closed: target reached
Note
Update, Good luck😉
Note
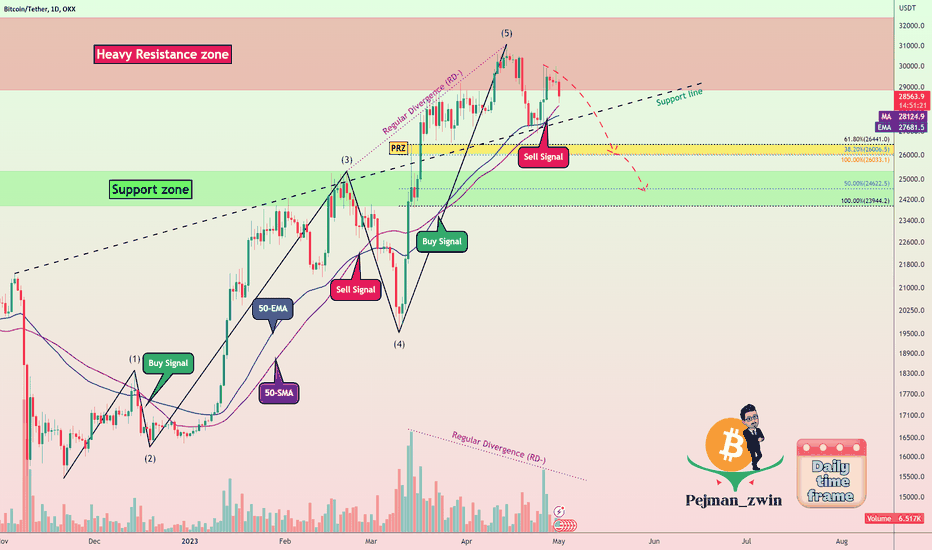
Bitcoin Daily Time frame.
🎁Welcome than a 50% bonus(Low Spread)👉vtm.pro/Y3AV7r
🎁Get a 20% Discount on your trading FEE on BYBIT:👉partner.bybit.com/b/PEJMANZWIN
🎁Get a 20% Bonus & 30% Discount on LBANK exchange(NO KYC)👉lbank.one/join/uBythQd
🎁Get a 20% Discount on your trading FEE on BYBIT:👉partner.bybit.com/b/PEJMANZWIN
🎁Get a 20% Bonus & 30% Discount on LBANK exchange(NO KYC)👉lbank.one/join/uBythQd
Related publications
Disclaimer
The information and publications are not meant to be, and do not constitute, financial, investment, trading, or other types of advice or recommendations supplied or endorsed by TradingView. Read more in the Terms of Use.