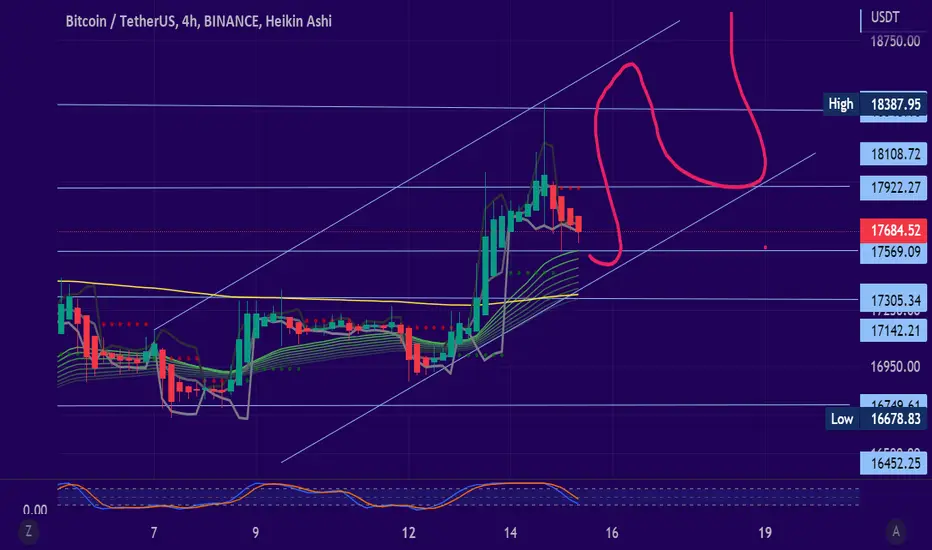
BTC is currently in a short-term uptrend. Two days ago BTc is above the MM200 which has now become a support, currently at 17326.00. It could pull back to 17569.00 which would signal a bullish continuation pattern.
If Bitcoin price breaks and closes below the bottom of the channel on the 4-hour chart at around $17,332, it suggests that the short-term trend may be turning and falling.
Here are the supports and resistances:
S: 17569.09 / 17319.12 / 16736.28
R: 17922.27 / 18387.00
If Bitcoin price breaks and closes below the bottom of the channel on the 4-hour chart at around $17,332, it suggests that the short-term trend may be turning and falling.
Here are the supports and resistances:
S: 17569.09 / 17319.12 / 16736.28
R: 17922.27 / 18387.00
Disclaimer
The information and publications are not meant to be, and do not constitute, financial, investment, trading, or other types of advice or recommendations supplied or endorsed by TradingView. Read more in the Terms of Use.
Disclaimer
The information and publications are not meant to be, and do not constitute, financial, investment, trading, or other types of advice or recommendations supplied or endorsed by TradingView. Read more in the Terms of Use.