Observations:
> Short-term, one would expect an upward trend (selling exhaustion) but no major gains is expected... signs of divergence in the 30 min.
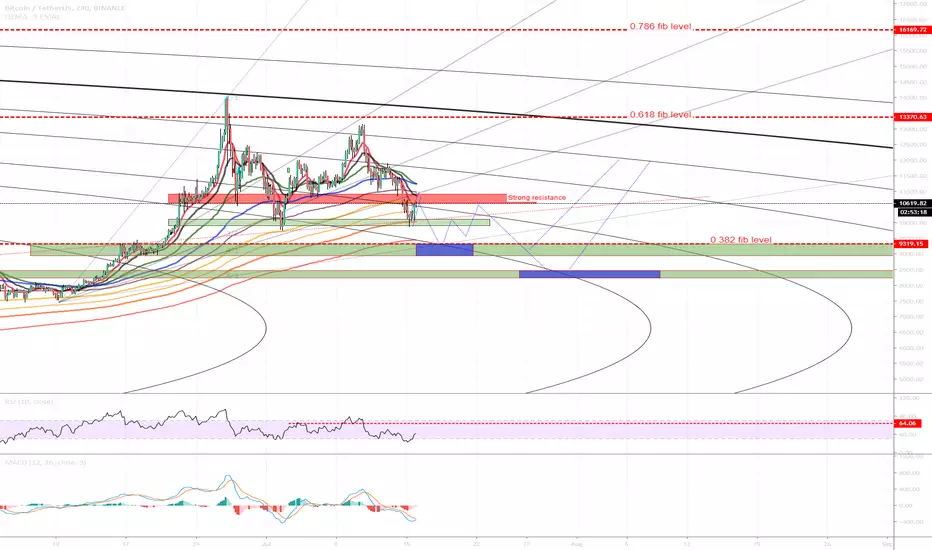
> We have also established what was a strong support to be a strong resistance (in the 4 HRLY) red zone, which equates to the 200 EMA on the 4 HRLY. $10590
> The next line of resistance will be the 21 EMA, ~$10890
> We see the 10 and 20 EMA almost crossing over on the DAILY (Bearish)
> Depending on the time frame, one can see the EMAs are acting as resistances for each bounce
> Some key lines have been honored as support and resistances based on FIB LEVELS\Lines depending on the tool of choice (they compliment each other)
> We can say that we are in a consolidating \ pullback pattern which was expected and wanted by many but can only be confirmed later, its an assumption.
> Daily RSI operating in the bearish region, bottom half of the grid (44%)
> 4 HRLY RSI bullish short term.
> Daily MACD still bearish but in the 4 HRLY some possible more up gains.
> Volumes are not impressive compared to previous up rallies.
Most probable we have a short uptrend because of the sell off however it will be short lived and rejected near 10900 to 11K.
> Looking for a green candle open and closure above the RED region for a positive sign on the DAILY for a resumption to back in the up trend.
If further drops, I'm looking at the key fib level, 9200 to 9500 however don't expect it to reach it due to FOMO.
One key note: the 8500 to 9000 range requires to be filled due to CME BTC Futures, so the theory goes. I suspect its on this down trend.
30 Min chart

CME BTC Futures chart

> Short-term, one would expect an upward trend (selling exhaustion) but no major gains is expected... signs of divergence in the 30 min.
> We have also established what was a strong support to be a strong resistance (in the 4 HRLY) red zone, which equates to the 200 EMA on the 4 HRLY. $10590
> The next line of resistance will be the 21 EMA, ~$10890
> We see the 10 and 20 EMA almost crossing over on the DAILY (Bearish)
> Depending on the time frame, one can see the EMAs are acting as resistances for each bounce
> Some key lines have been honored as support and resistances based on FIB LEVELS\Lines depending on the tool of choice (they compliment each other)
> We can say that we are in a consolidating \ pullback pattern which was expected and wanted by many but can only be confirmed later, its an assumption.
> Daily RSI operating in the bearish region, bottom half of the grid (44%)
> 4 HRLY RSI bullish short term.
> Daily MACD still bearish but in the 4 HRLY some possible more up gains.
> Volumes are not impressive compared to previous up rallies.
Most probable we have a short uptrend because of the sell off however it will be short lived and rejected near 10900 to 11K.
> Looking for a green candle open and closure above the RED region for a positive sign on the DAILY for a resumption to back in the up trend.
If further drops, I'm looking at the key fib level, 9200 to 9500 however don't expect it to reach it due to FOMO.
One key note: the 8500 to 9000 range requires to be filled due to CME BTC Futures, so the theory goes. I suspect its on this down trend.
30 Min chart
CME BTC Futures chart
Note
Progress update: Approaching critical point to overcome. Question is will more come to the rally and price refuse to drop (RSI should go up in that case as price follows demand. or will the next 4 hours see a sell off (divergence appearing)?Note
Note
RSI resistance on the 4 HRLYNote
Another perspective\pattern? The highest I can see this going, with the ABC move where B is the current movement is 11200. Just a reminder this is based on probability. Who knows where whales want to take it. I would expect them to observe, look at the fomo volume\response and then decide to pump or not to pump as it sure doesn't look natural with the last 2 waves in the 5 min. chartNote
Interesting to see the Crypto GREED and FEAR index. It makes me wonder if I should buy because FEAR is on the EXTREME end, 16. Maybe just need to wait for this last drop to have EXTREME fear lower matching my TA. Remember this > Warren Buffett once said that as an investor, it is wise to be “Fearful when others are greedy and greedy when others are fearful.” alternative.me/crypto/fear-and-greed-index/
Note
Things are changing. If we break 11050 and stay above, a 4 HRLY candle, then my bias will change.Note
Or above the 21 and or 10 EMA on the DailyNote
From an article which I agree with for the current situation.There are two prominent resistance levels at $10,950 and $10,980. The $10,950 level has the daily 23.6% Fibonacci retracement level and 1-hour previous high, while the most robust resistance level, $10,980, has the previous-week low.
On the downside, there is one substantial support level at $10,780, which sees a confluence of the 50-day simple moving average (SMA 50) curve and daily Bollinger band middle curve.
Note
This is what I call on a knife's edge...on the 5 minNote
For the record.. seems to be a big rejection at the 21 EMA on the 4 HRLY. Question on my mind is will there be bounce at a key fib level within this bounce, the bottom of the B.Band. If this doesn't hold (also 55 EMA on the 30min)...I think unlikely as people will move their stop limits higher as most people will trade short. Hence why we see selloff's in bigger numbers... it is a downtrend still.Note
The weekly doesn't give much except the MACD and DI index, both showing a movement towards the down path. Also just above the 8 EMA, if we go below this, then the weekly Candlstick says the next is the low 9K range, complimenting the 4 HRLY range of 9k to 9400.Note
After further developments, I believe the new target is 11,500. The price is refusing to drop and the pattern is similar to the previous upward wedge before it goes down.Note
Can be see a bounce with a double bottom...very difficult to say...we will need to see some strong bullish divergence...that's what I'll be looking for going short.Note
Just woke up!! Bloody thing won't let you sleep...Before I went to bed, I saw no divergence at the 9400 to 9600 range, and hence places some orders at 9k and 9.1K. I see divergence on the 15 minutes...
close to buying time.
Note
4 HRLY Chart.... divergence there as well. We are pretty much near the bottom on this stage.... look for shorts but don't be too greedy.Note
After much deliberations... I have tweaked my thoughts based on what I see on the weekly, daily, and short term and the belief is that we are blowing of the top and will go down much further, 7500 for now. Depending what happens on the way down only then can we fill in the gaps. I'll do another post with my explanations.Discord: discord.com/invite/vb4hbP88vb (TradeToProspa)
Telegram: t.me/TprospaTradersbot
This community has signals now but with no risk management comms.
Telegram: t.me/TprospaTradersbot
This community has signals now but with no risk management comms.
Related publications
Disclaimer
The information and publications are not meant to be, and do not constitute, financial, investment, trading, or other types of advice or recommendations supplied or endorsed by TradingView. Read more in the Terms of Use.
Discord: discord.com/invite/vb4hbP88vb (TradeToProspa)
Telegram: t.me/TprospaTradersbot
This community has signals now but with no risk management comms.
Telegram: t.me/TprospaTradersbot
This community has signals now but with no risk management comms.
Related publications
Disclaimer
The information and publications are not meant to be, and do not constitute, financial, investment, trading, or other types of advice or recommendations supplied or endorsed by TradingView. Read more in the Terms of Use.